
Daniel Chartouni ABB Corporate Research Baden-Daettwil, Switzerland, daniel.chartouni@ch.abb.com; Srinidhi Sampath ABB Corporate Research Västerås, Sweden, srinidhi.sampath@se.abb.com; Silvio Colombi ABB ELSP Smart Power Quartino, Switzerland, silvio.colombi@ch.abb.com
The drive to decarbonize the world has prompted most automobile manufacturers to invest heavily in electrifying their product lines – a move expected to generate a future battery demand of hundreds of GWh annually.
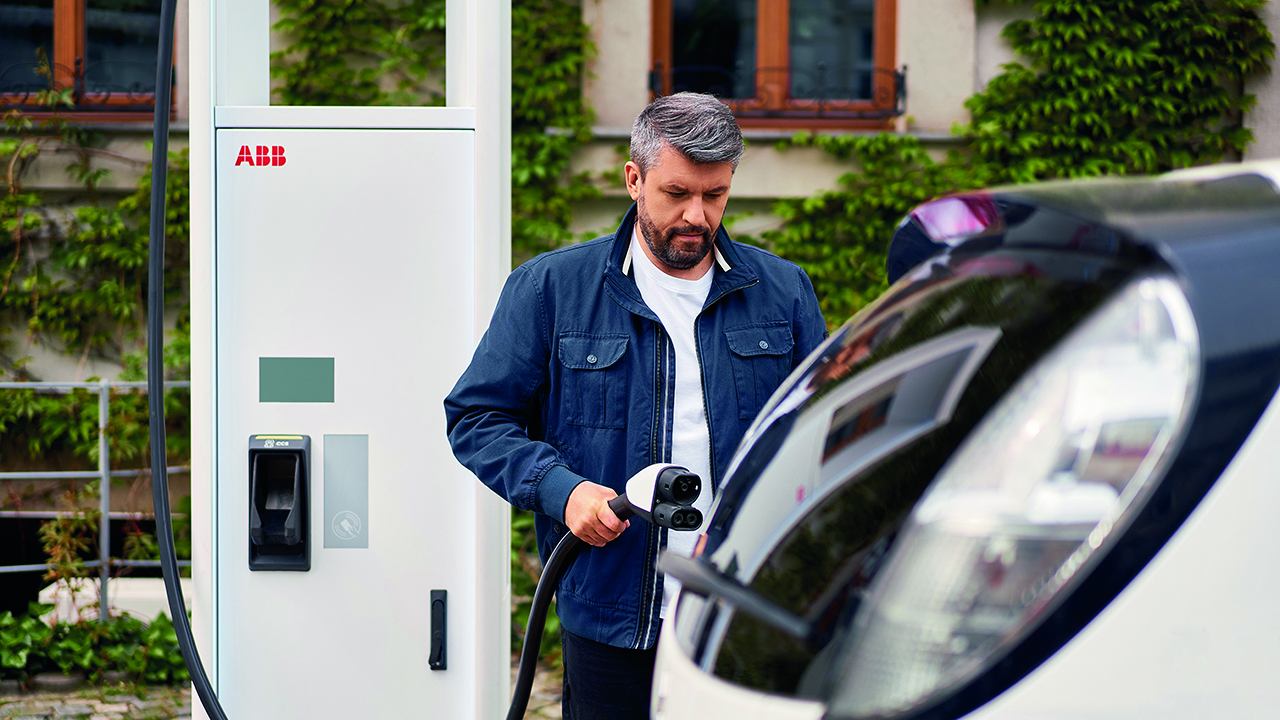
However, ever since the introduction of BEVs, the sustainability aspect of battery production – as well as the sustainability of the production of the BEVs themselves – has been a hotly debated topic, although it must be borne in mind that a battery, though not necessarily a sustainable device in itself, can enable something else to operate sustainably. But the question remains: given the carbon footprint of both the BEV and battery production, are BEVs, over their lifetime, more sustainable than their traditional ICE counterparts →01?
To answer this question, ABB conducted a study on two passenger vehicles of similar size (five-seaters): an ICE vehicle, represented by a Volkswagen Golf GTD, and a BEV, represented by a Volkswagen ID.4. Life-cycle emissions of carbon dioxide (CO₂) were compared for the manufacture of each vehicle. Also, fuel “well-to-tank” and exhaust emission data for the ICE were collected, as was data related to emissions from BEV battery manufacture and the lifetime electricity consumption of a BEV [1,2].
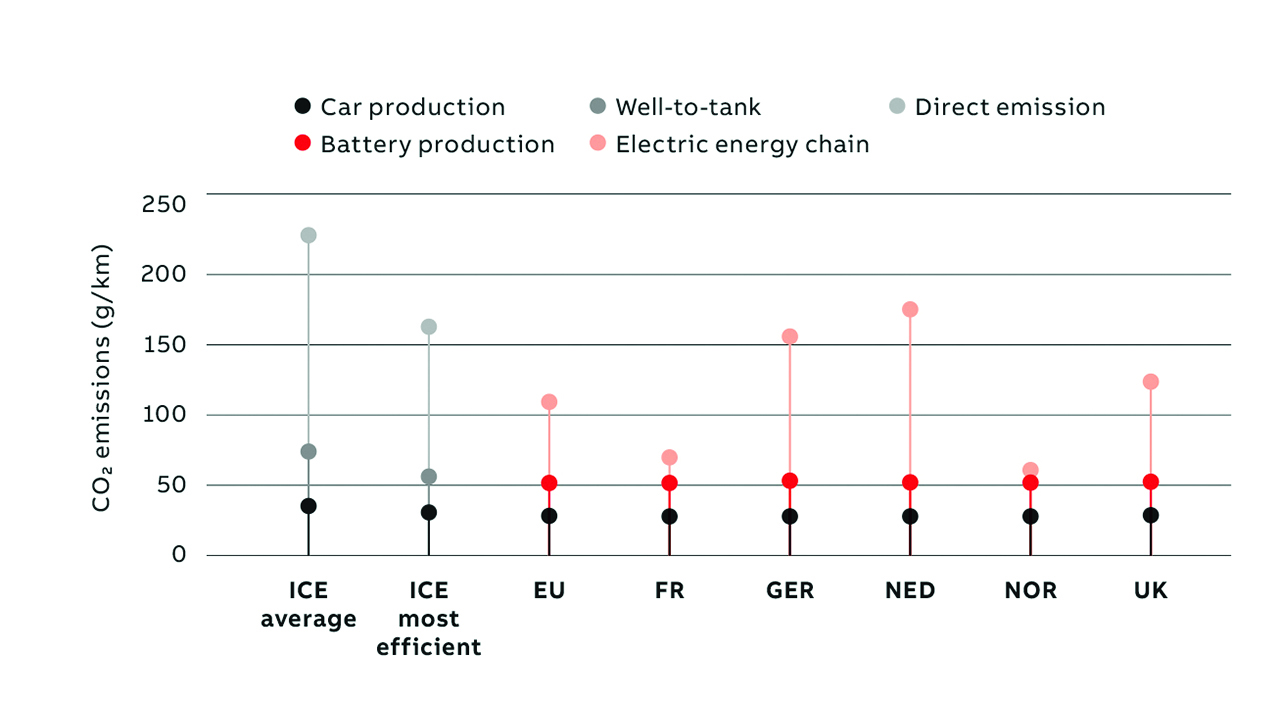
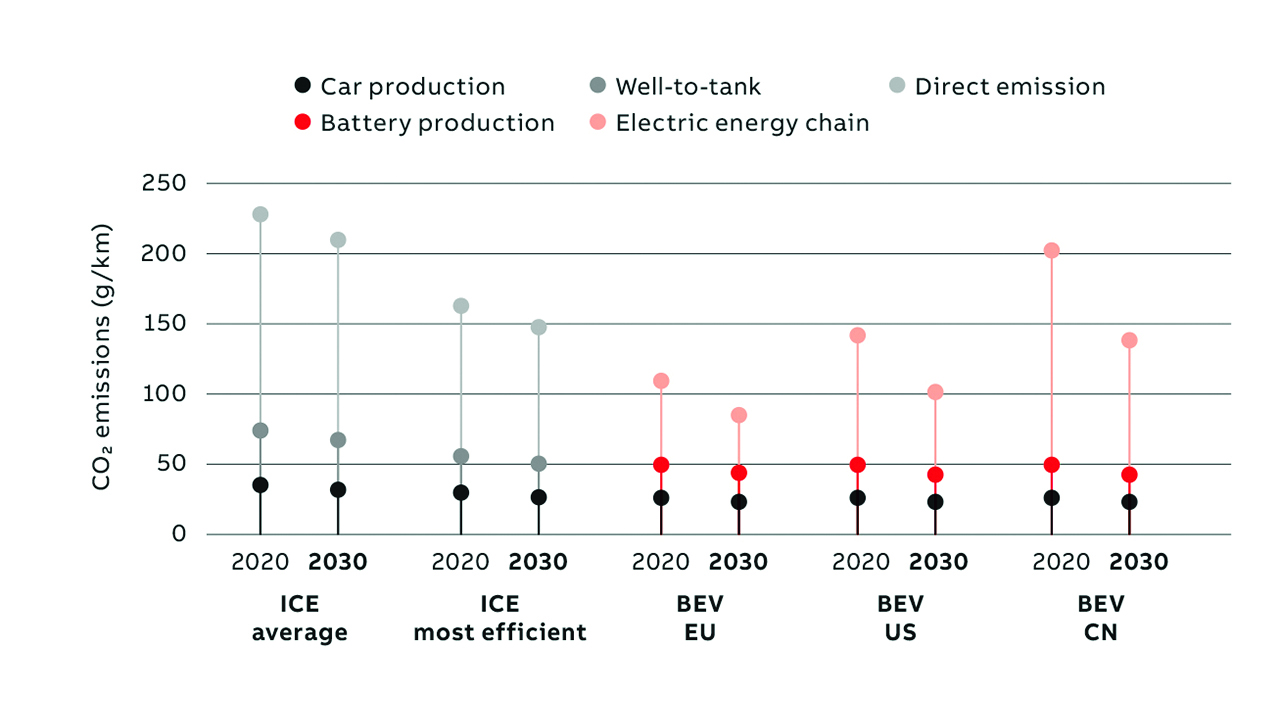
These emissions were converted into equivalent grams of CO₂ per kilometer driven (gCO₂eq/ km), assuming a vehicle lifetime of 240,000 km. Average-efficiency and most-efficient ICE cars were taken and a steadily increasing BEV battery capacity up to the year 2030 was assumed. Published data was used where available [3], combined with ABB’s estimation of trends from 2015 to 2030 →02-03. For instance, in car manufacturing and in direct emissions of ICEs, annual improvements of up to 1 percent were taken when estimating values up to 2030.
Battery production and use
Emissions arising during BEV battery production and BEV use were estimated in detail. A nickel manganese cobalt (NMC) type of lithium-ion battery chemistry was considered – NMC batteries are the most popular and have a higher energy density than other chemistries. Battery materials, cell manufacturing, and pack and module assembly were included in the study. Future scenarios were estimated based on an increasing battery energy density.
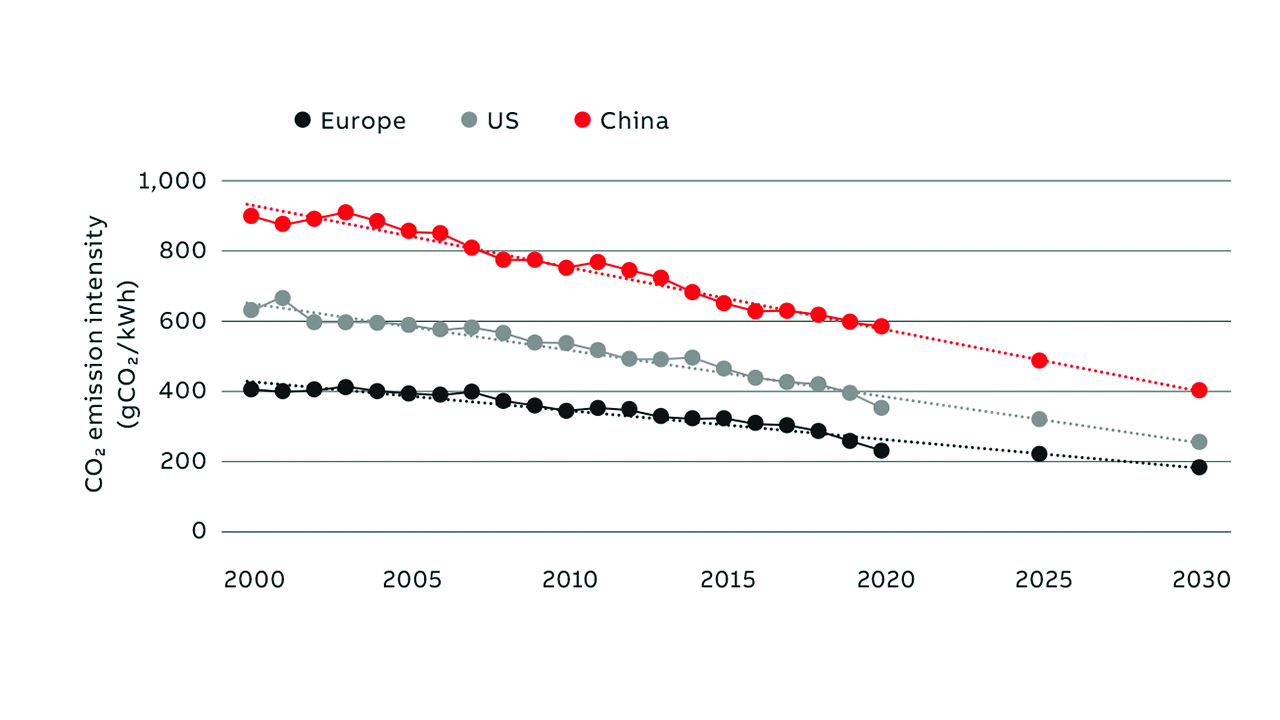
For the BEV use phase, power grid CO₂ emissions in the EU, USA and China were linearly extrapolated from 2020 to 2030 [4,5]. Since 2020 emissions were affected by the pandemic, values for this year were taken from a trend line based on 2000 to 2021.
A further 25 percent was added to emissions to account for upstream losses during electricity production [6], transmission and distribution; the same number was used for the fuel well-to-tank emissions. A 0.85 percent improvement per year for the electricity consumed as fuel during the use phase, coupled with a 92 percent efficiency during charging, was also assumed. These numbers and percentages reflect a realistic estimation of all the contributions to emissions during the life cycle of a passenger car.
The analysis presented here only looks at the CO₂ footprint in gCO₂/km over the lifetime of the car and does not include aspects that increase the attractiveness of BEVs such as:
• Air quality improvement in urban areas heavily affected by ICE vehicle emissions.
• Traffic congestion, where idling ICE vehicles create emissions.
• Other form of pollution – for example, NOx, carbon particles in exhaust fumes, dust from brakes (BEV regenerative braking reduces the amount of such dust), oil leaks, etc.
Data analysis
In both ICE and BEV vehicles, it was found that the primary contribution to emissions arises during the use phase. For ICE vehicles, it is “tailpipe” or direct emissions; for BEVs, it is the electricity energy chain. The emissions from the electricity chain show a decreasing trend due to an increasing renewable energy content, although with different trend slopes for the various regions and countries covered in this study →04.
For battery production, the main energy consumers are NMC powder production, the manufacture of the aluminum used in modules and packing, and drying and storage of the mixed and coated powders used in the battery [7-10].
This study found that the overall CO₂ emissions for BEV versus ICE vehicles depend on the region or country. For example, in the EU or USA, BEV vehicles are already better than the most efficient ICE vehicles, ie, emissions from BEVs are lower than emissions from the most efficient ICE vehicle. In China, BEVs are better than the average ICE today and will be better than the most efficient ICE by 2030. ABB made conservative assumptions in this study, so these projections could have an upside.
Some other considerations are not included in this study. For example, emissions from idling ICEs, mentioned above, but also the emissions saved by BEV regenerative braking and lower maintenance. Moreover, ABB believes there will be a plateau in ICE emissions as this technology is mature, whereas innovation will accelerate BEV emissions reduction. Also not considered are future technologies such as vehicle-to-grid, where the BEV participates in the national power grid as an energy source or storage device, thus enabling emissions reduction in grid power generation. In other words, the picture for BEV emissions will most likely be rosier than that painted here.
Powering into the future
The question of whether an ICE vehicle is better than a BEV vehicle in terms of CO₂ emissions has been answered by a detailed study of cradle-to-gate life-cycle emissions conducted on comparable five-seater vehicles. This study took into account published life cycle analysis studies on manufacturing, battery production, fuel supply, electricity generation and distribution, as well as usage emissions. It was observed that BEVs already have lower emissions than the best ICE vehicles in the EU and USA; China lags somewhat but is catching up rapidly. Significantly, emissions were found to come mainly from the use stage of both types of vehicles. For BEVs, emission reductions are dominated by declines in power grid emissions, primarily brought about by grid decarbonization. The BEV value proposition will become even more attractive as countries adopt more renewable energy sources.
The study presented here does not include any impact on carbon footprint related to recycling either type of automobile or the BEV battery. The reuse or recycling of batteries is continuously and rapidly evolving, including so-called second-life uses, so any assumptions made may not be valid over the period of the estimation (2015-2030). However, a future study may revisit this topic to quantify the impact of carbon emissions in the post-use phase of the vehicles discussed.
References
[1] Cox B. et. al., “Life cycle environmental and cost comparison of current and future passenger cars under different energy scenarios,” Applied Energy 269 (2020). Available: https://www.sciencedirect.com/science/article/pii/S030626192030533X. [Accessed January 24, 2023.]
[2] Hall D. et. al, “Effects of battery manufacturing on electric vehicle life cycle greenhouse gas emissions,” ICCT Briefing, Feb 2018. Available: https://theicct.org/publication/effects-of-battery-manufacturing-on-electric-vehicle-life-cycle-greenhouse-gas-emissions/. [Accessed January 24, 2023.]
[3] Philippot M. et. al, “Eco Efficiency of a Lithium Ion Battery for Electric Vehicles: Influence of Manufacturing Country and Commodity Prices on GHG Emissions and Costs,” Batteries 2019, doi:10.3390/batteries5010023. Available: https://www.researchgate.net/publication/331225913_Eco-Efficiency_of_a_LithiumIon_Battery_for_Electric_Vehicles_Influence_of_Manufacturing_Country_and_Commodity_Prices_on_GHG_Emissions_and_Costs. [Accessed January 24, 2023.]
[4] International Energy Agency, “Electricity Market Report December 2020.” Available: https://www.iea.org/reports/electricity-market-report-december-2020. [Accessed January 24, 2023.]
[5] Ember, “European Union: The gas crisis interrupts a rapid coal exit.” Available: https://ember-climate.org/countries-and-regions/regions/european-union/. [Accessed January 24, 2023.]
[6] Moro A. et. al, “Electricity carbon intensity in European Member States: Impacts on GHG emissions of electric vehicles,” Transportation Research Part D 64 (2018). Available: https://www.semanticscholar.org/paper/Electricity-carbon-intensity-in-European-Member-on-Moro-Lonza/f639b05f1e3cdf40c7a89c86c9b450677aae6245. [Accessed January 24, 2023.]
[7] Emilsson E., Dahllöf L., “Lithium Ion Vehicle Battery Production, Status 2019 on Energy Use, CO 2 Emissions, Use of Metals, Products Environmental Footprint, and Recycling,” IVL Swedish Environmental Research Institute, (2019). Available: https://www.ivl.se/download/ 18.14d7b12e16e3c5c36271070/1574923989017/C444.pdf. [Accessed January 24, 2023.]
[8] Bieker G., “A Global Comparison of the Life cycle greenhouse Gas Emissions of Combustion Engines and Electric Passenger Cars,” ICCT 2021 International Council on Clean Transportation Europe, White Paper 2021. Available: https://theicct.org/sites/default/files/publications/Global-LCA-passenger-cars-jul2021_0.pdf. [Accessed January 24, 2023.]
[9] Dai Q. et. al., “Life Cycle Analysis of Lithium Ion Batteries for Auto motive Applications,” MDPI, Batteries, 2019, doi:10.3390/batteries5020048, Available: https://www.mdpi.com/2313-0105/5/2/48. [Accessed January 24, 2023.]
[10] Chen Q. et. al. “Investigating carbon footprint and carbon reduction potential using a cradle-to-cradle LCA approach on lithium-ion batteries for electric vehicles in China,” Journal of Cleaner Production 369 (2022). Available: https://www.sciencedirect.com/science/article/pii/S09596526220 29286?via%3Dihub. [Accessed January 24, 2023.]