
Ruomu Tan, Martin Hollender, Chen Song, Arzam Kotriwala ABB Corporate Research Center, Ladenburg, Germany
ruomu.tan@de.abb.com, martin.hollender@de.abb.com, chen.song@de.abb.com, arzam.kotriwala@de.abb.com
Heiko Petersen, Dominic Haas ABB Process Automation, Mannheim, Germany
heiko.petersen@de.abb.com, dominic.haas@de.abb.com
Despite the emergence of machine learning (ML) techniques in a variety of industries that can handle dynamic and complex processes based on the proliferation of available data, the chemical process industry is not always able to use this data optimally in their continuous production processes. Even though the increased abundance of available historical time series data from various plant operating states, eg, startup, shutdown, half-load or full-load, might be available as the Internet of Things (IoT) devices proliferate, determining state is no easy matter. There are many reasons for this. For example, manual operations can cause a change in the operating state; the signature of various states usually coexist within a large amount of data, making identification of these states difficult. Moreover, a number of substates could exist within one operating state, thereby further complicating state determination.
ABB set out to resolve such challenges by providing a means to accurately identify and calculate the process state and substates to enable operators to more accurately evaluate and correct production processes.
Why determine the state?
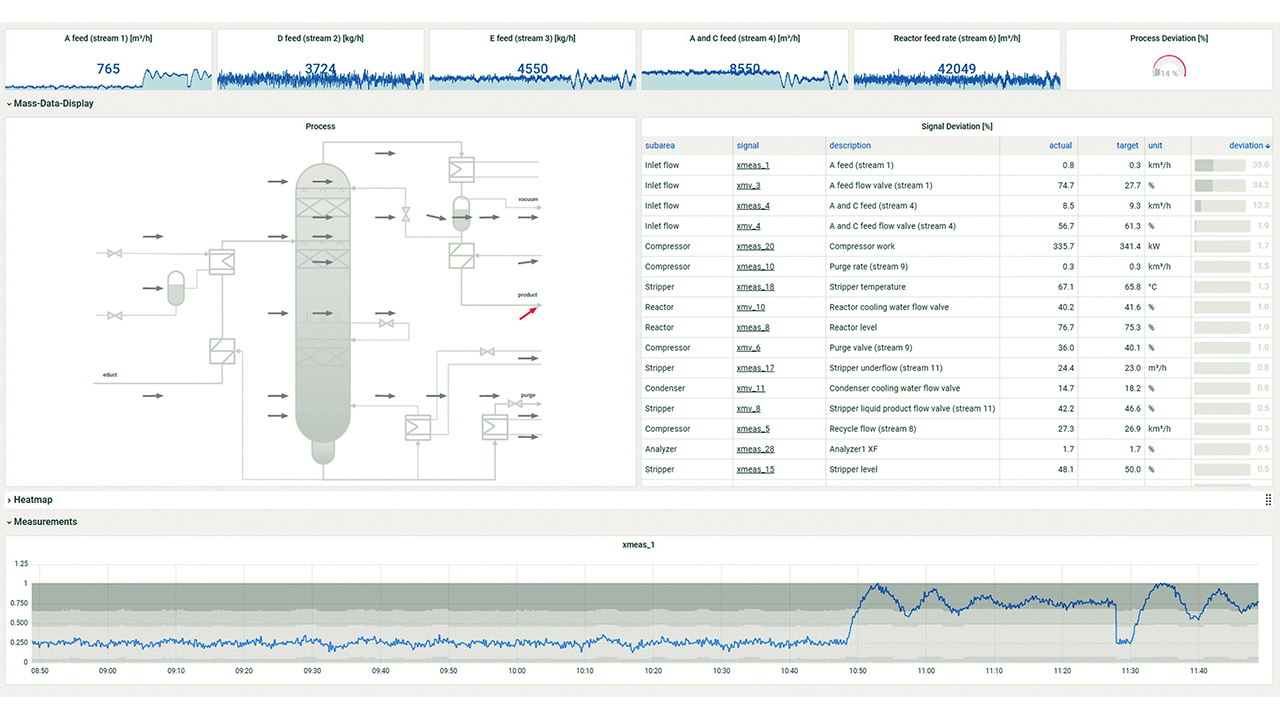
Imagine that the feed flow rates of multiple types of fuel gas influence the operating status of a gas-fired power plant. When analyzing data from such processes, it is critical to incorporate information about process state because the exact same behavior exhibited by the data in one state can be normal, yet indicate a fault in another state. It follows that the optimal way to operate the process in question can deviate dramatically depending on the operating states. In addition to contributing to safe operations, the occurrence and the characteristics of each operating state could be relevant for experts in their evaluation of the performance of the process to enable more efficient and sustainable operation →01.

Providing the correct and optimal support to a specific determined scenario is critical. Therefore, ML models, which are configured to support operators in such processes, should be state-aware. In turn, this means that the information about operating states should be included as a prerequisite for data analysis and ML model building. Such determination is demanding for a myriad of reasons: The process operating states might not be explicitly documented, or if documented the format could be difficult to process for data analysis and ML model configuration. Moreover, the root cause of the change of operating states could make identification challenging because of the sheer number of manual operations present during the production process in question.
Solution architecture
In a rigorous effort to address these challenges, ABB developed an innovative architecture using ML-based techniques →02. In offline training of the model, this data-driven solution utilizes signatures of the varying operating states to identify the states derived from the unlabeled, historical time series data and to label them accordingly. For example, the generated power is correlated with the power plant load; a high value for generated power would indicate that the process is in the full-load state while less generated power might indicate that the process is running at a half-load state.
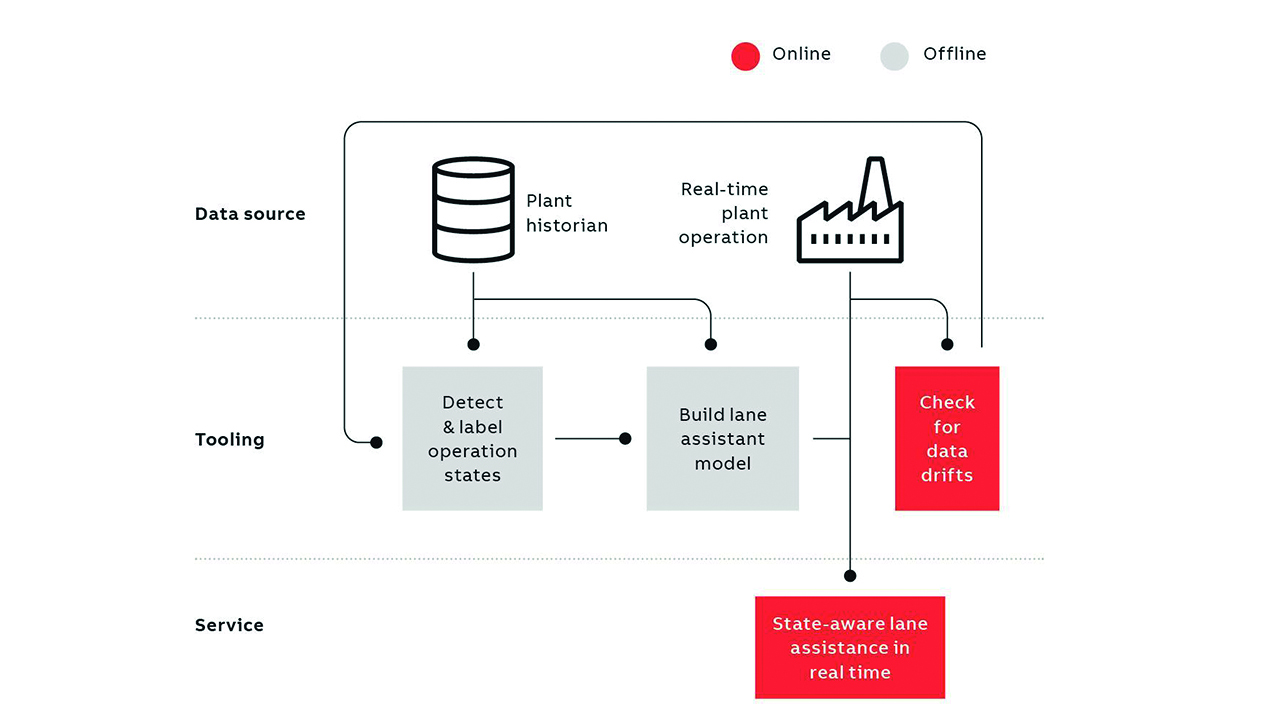
ABB’s solution can successfully identify states with simple signatures and such that are more complex. With the operating states identified, the solution then analyzes the operation and configures state-aware ML models that generate the operating lanes for all, or, the most important operating states individually.
When deployed for online operator support, this solution labels the currently active operating state in the process using the available online data and applies the corresponding ML model to generate operating lanes for operator support in real-time. Simultaneously, it monitors the drift in the online data, eg, when none of the previously identified states can be applied to the newly generated data, and triggers the retraining workflow such that the new operating states can be identified and the ML models can be updated to account for the new states.
ABB’s innovative solution is part of ABB Ability™ PlantInsight Operator Assist, which provides a compact overview of complex plants and appropriate support for operating personnel in these plants. The solution is developed for and has been verified in several customer use cases with real-life datasets from various processes, such as chemical production, oil refineries and power plants.
Data-driven state identification
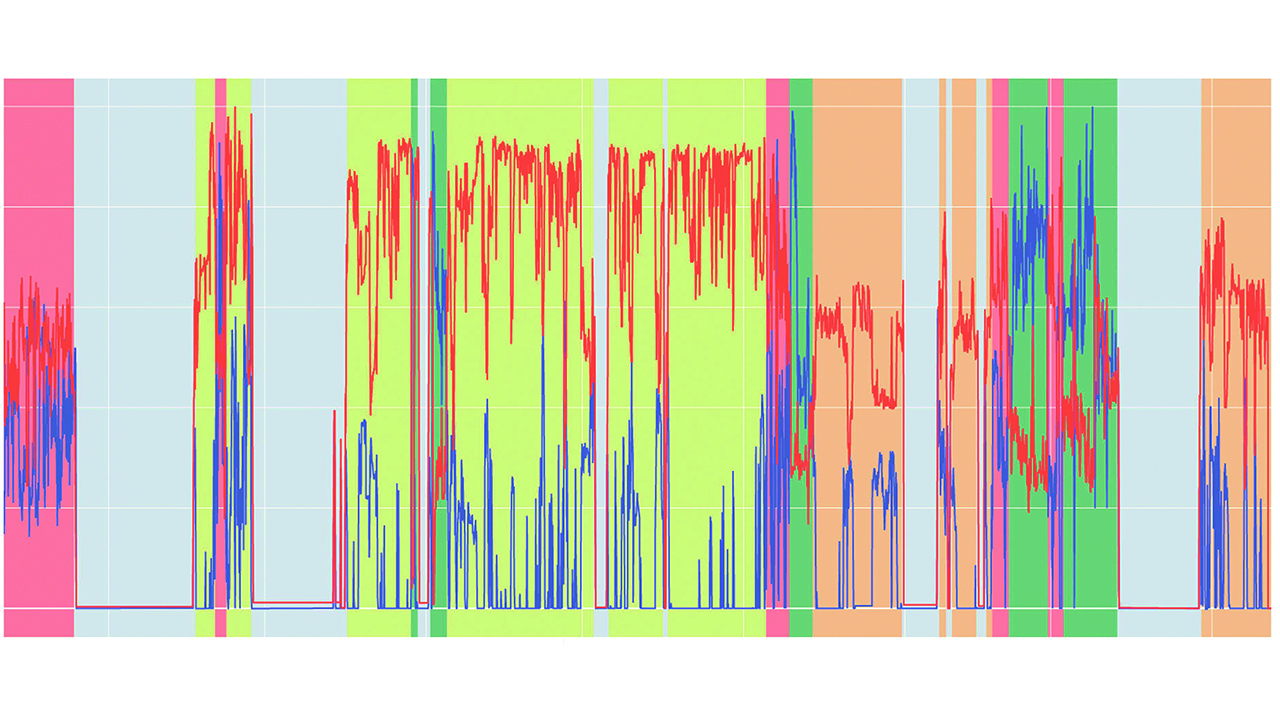
In the first step of the workflow, the historical time series data are segmented and clustered using unsupervised time series clustering algorithms such as the well-known time-series KMeans and Toeplitz Inverse Covariance-Based Clustering (TICC) [1]. The clusters of the segment should represent various operating states. An example of the identified states is given in →03, namely “running”, “not running”, “startup” and “shutdown”, from the unlabeled time series data. The “running” and “not running” states can be easily distinguished from one another by evaluating the time trends, ie, all process variables had non-zero values when the process was in the “running” state as exhibited by the pink-colored area in →03 while all variables have almost zero values when the process was “not running” as displayed by the yellow area in →03. In the case of a short period when a shut-down occurred, followed by a startup, ABB’s solution successfully identified the short but significant transition periods of “startup” (orange area) and “shutdown” (green area) →03.
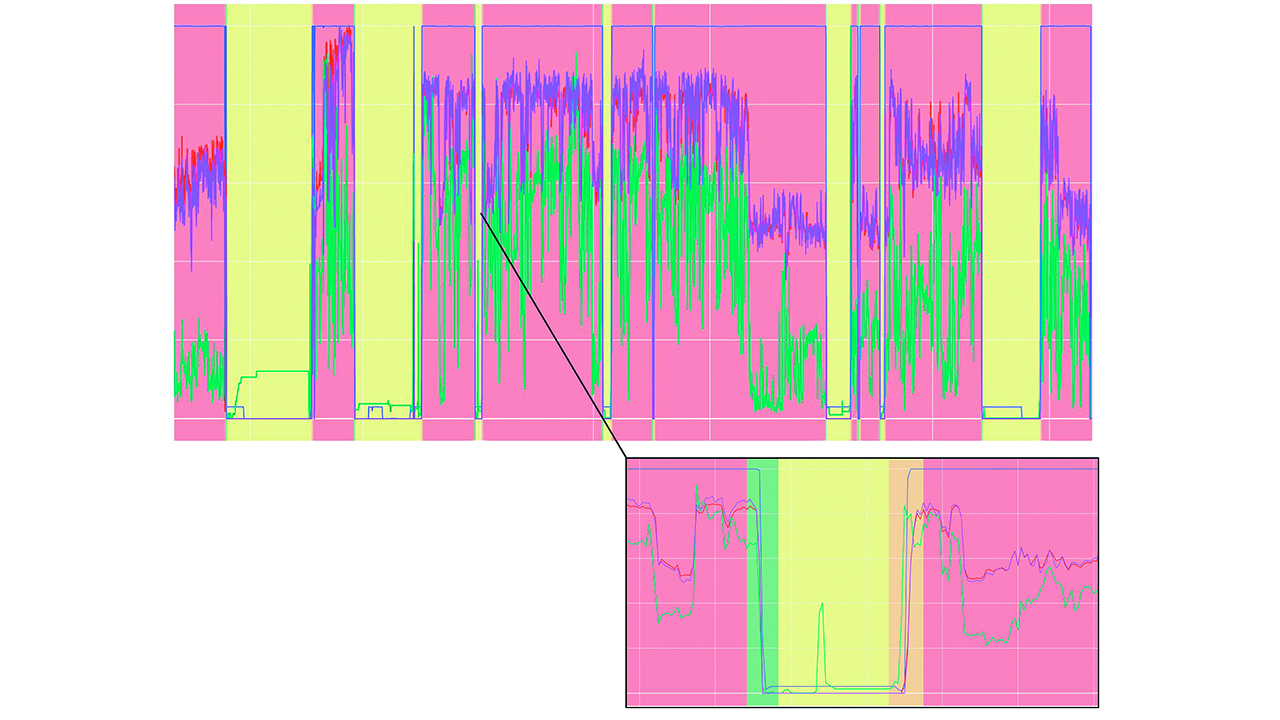
Because the major states, ie, “running” and “not running” are identified during the process, even though the process was constantly running, the possible existence of substates within the major states are indicated in this case. By applying the time series clustering algorithm to the time windows identified to be one or more specific major states, ABB’s solution enables the identification of possible substates. In one instance, the substates correspond to the flow rates of two different types of fuels (indicated by red and blue lines on the graph), and the ratio between these rates, which are being supplied during the process under investigation. In this example, the yellow-colored period indicates when the “red” fuel was dominant and the “blue” fuel was insignificant; whereas the green-colored period is identified as the time in which the “blue” fuel was more dominant than the “red” fuel.
Thus, ABB’s ML-based fully automated solution identifies the operating states and substates existing in the process under investigation rapidly, accurately, and easily. The task of identification of the states by a human expert would, in contrast, be tedious, time-consuming and therefore less efficient.
Analysis of the states
Once operating states are identified, ABB’s solution goes one step further by analyzing the operating states to generate additional useful insights regarding the historical performance of production. For example, the statistics of the identified states and corresponding periods represented in the historical data can be calculated. Two examples of the statistics employed do just that →05, namely to analyze the duration of each operating state and the frequency of the transitions between the states. The conclusion could be that the running time is around 65 percent and the not-running time is 20 percent, approximately, over the given period. Additionally, a typical operation sequence can be identified from the frequency analysis that such a sequence makes: “running” → “shutdown” → “not-running” → “startup” → “running” (R→D, D→N, N→U, U→R) →05. It is noteworthy that the transition from “startup” to “not running” occurred once; this might indicate an unsuccessful attempt to startup. Such information would be relevant in regard to a retrospective analysis of the production performance.
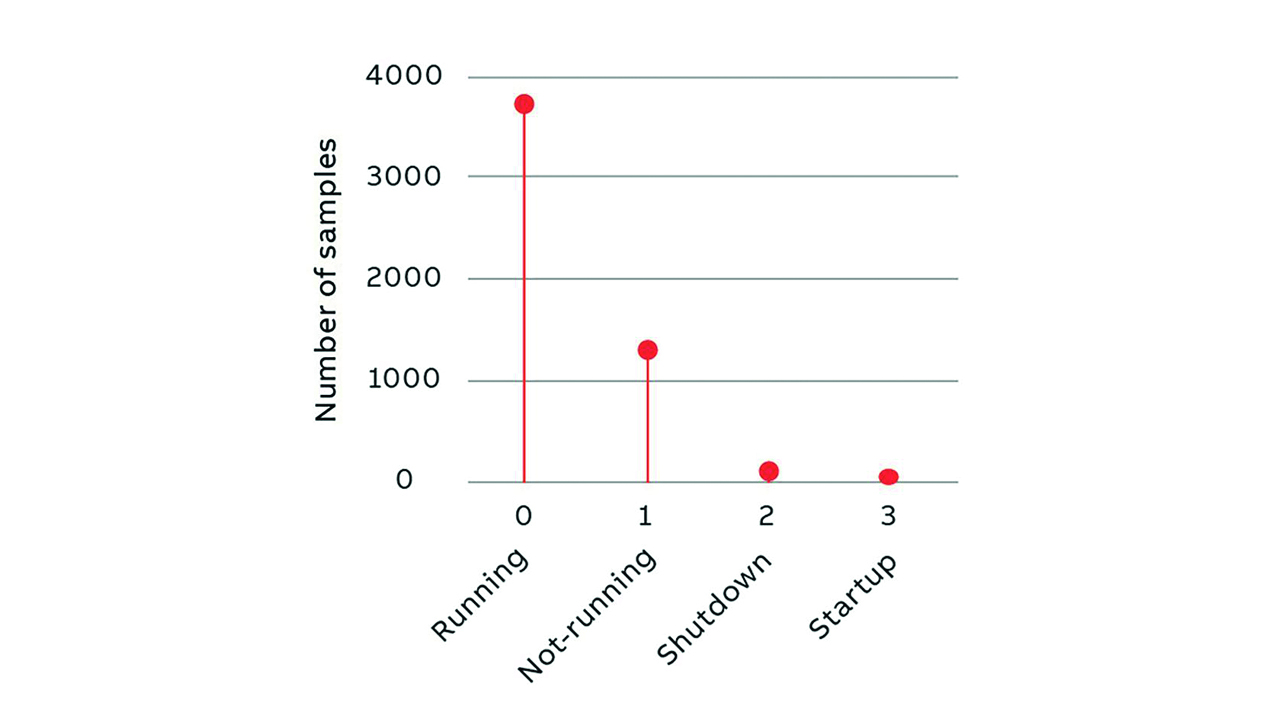
05a Duration of each operating state is shown. 
05b Transition frequencies between the states are shown (R: “running”; N: “not-running”; U: “startup”; D: “shutdown”).
05 Statistical results of the operating states.
Moreover, the labels generated by the unsupervised time series clustering algorithm can be further leveraged and explained by XAI (explainable AI) methods [2], which will soon become mandatory in the EU, to extract rules for process operation. For example, for the “running” state presented in →03, the rule would be: when the blue curve is above a certain threshold value, which fits well with the empirical knowledge of the process experts, such that: when the process is running normally, a key process variable should be nonzero. Such rules not only enhance the confidence of domain experts in data-driven solutions, a challenge in sophisticated data-driven solutions, but will also yield insights when labeling of the operating states occurs in real-time.
State-aware lane assistance
To present information to the operator in an intuitive and efficient way, ABB Ability™ PlantInsight Operator Assist adopts the concept of operating “lanes” as if the operator was driving their process and, as such, they should remain in the lane to guarantee safe, sustainable and efficient production→06. The lane is presented as a dynamic, adaptive band around the time trend of selected process variables.
ABB’s solution further empowers the configuration of the operating lanes via multivariate, state-aware ML models. One way to accomplish this task is to train one ML model, eg, an autoencoder, for each important operating state using data collected from this state only. Such ML models can capture the behavior of the process in a given state better than a general model that is trained using data from a variety of states [3]. The ML models are then used to calculate the operating lanes; such lanes take into account both the current process state and the relationship between several process variables. Compared to the bandwidth of conventional static alarm limits of process variables, such lanes are much more adaptive and can be much narrower; this can enable early detection of even minor deviations of the process from the ideal production.
It is essential for both the operators and the operator support systems to be aware of the historical and present operating state, eg, the loading conditions, the input materials, and the expected grade of end product that may exist in their processes. Only in this way can they properly evaluate performance and make the right decisions accordingly. ABB’s ML-based solution addresses these needs by providing a fully automated, unsupervised workflow to enable the identification of the operating states and substates from time series data. Not stopping there, ABB’s innovative digital solution provides additional useful insights by deriving and presenting the historical states. The state information is incorporated in training state-aware ML models that generate operating lanes to detect deviations from optimal production.
With the state-aware support this solution offers, operators will be able to better understand and evaluate the production operation and performance in their specific processes, both historically and in the present, thereby maintaining a safe, sustainable, and efficient production.
References
[1] D. Hallac, et al., Toeplitz “Inverse Covariance-Based Clustering of Multivariate Time Series Data” in arXiv, 2018, Available: https://arxiv.org/abs/1706.03161v2 [Accessed July 17, 2023.]
[2] The Royal Society “Explainable AI: the basics policy briefing”, 2019, [Online] Available: https://ec.europa.eu/futurium/en/system/files/ged/ai-and-interpretability-policy-briefing_creative_commons.pdf [Accessed July 17, 2023.]
[3] R. Tan, et al., “An on-line framework for monitoring nonlinear processes with multiple operating modes” in Journal of Process Control, Vol. 89, 2020, pp. 119 – 130.