
ABB has developed an automated data-driven anomaly detection system to diagnose and inspect the product quality of robots with a view to boosting their operational health. Thanks to the ABB Ability™ Analytics Framework, the detection system has evolved from a prototype running on a single computer into a robust service characterized by superior scalabilities in terms of processing speed and data volume.
Nevroz Sen, Sriharsha Vardhan ABB Robotics San Jose, CA, USA, nevroz.sen@us.abb.com, sriharshavardhan.t@us.abb.com; Felix Mutzl ABB Ability™ Analytics Ladenburg, Germany, felix.mutzl@de.abb.com
It is an exciting time to be in the robot manufacturing business. The global industrial robotics market has been growing at a CAGR of 9.4 percent since 2017 and is expected to continue at that level to 2023 [1]. What is more, multi-purpose, re-programmable industrial robots, an important part of the automated production systems market [2], are evolving rapidly thanks to advances in machine learning. In this regard, one of the key application areas is performance characteristics and related test methods for manipulating industrial robots, which include pose and path characteristics and application-specific performance criteria. In addition, the precision performance of a robot’s manipulator can be described by pose accuracy and pose repeatability [3].
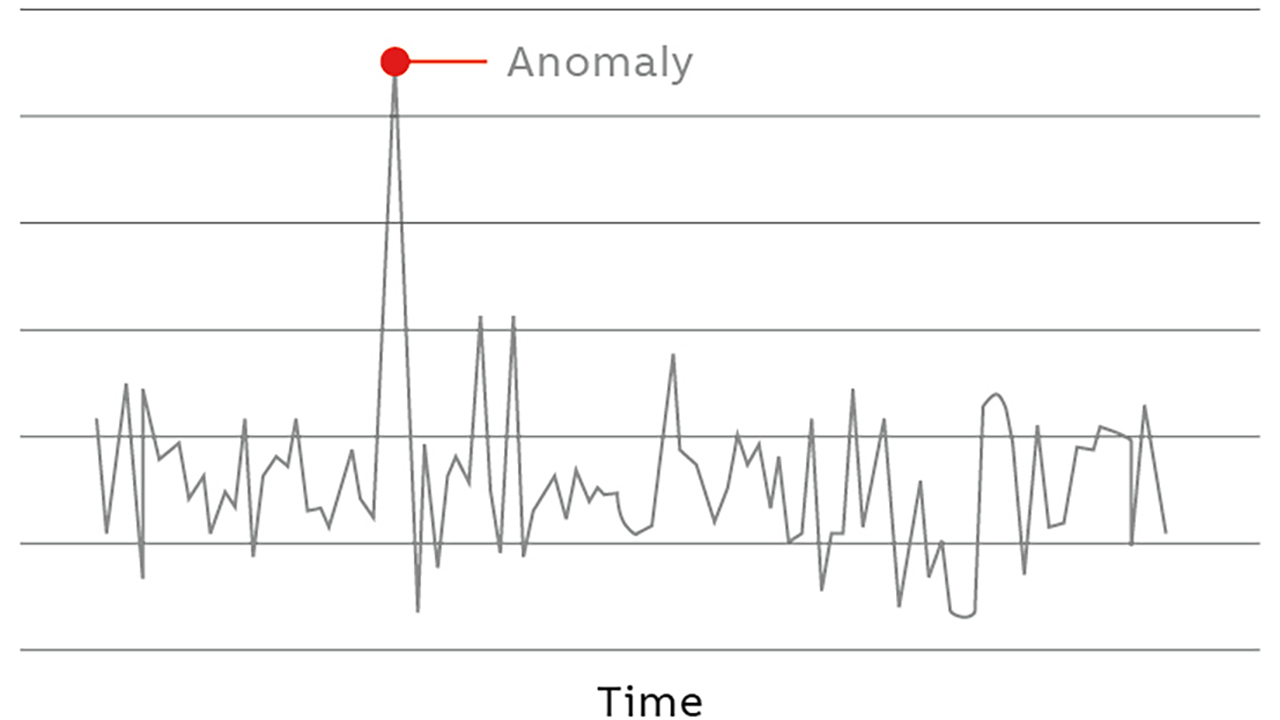
In the course of developing performance test methods, signals are collected at high frequency and analyzed to gain critical insights. Such insights help to enable experienced production personnel to classify a robot’s performance as normal or abnormal →01. The analysis involves observing general patterns and relationships among signals for specific robot types during specific test conditions. However, the large volume and complexity of the resulting data make human manual analyses unfeasible.
In the following pages, this article will describe how ABB is applying machine learning (ML) techniques to anomaly detection. In general, machine learning describes a process whereby a computer uses statistical models and algorithms to perform a task by relying on patterns and inferences instead of explicit rules. However, before a computer can perform a given task, its associated machine learning program will typically require a very large amount of data.
For the purposes of the present study, years of data that had been accumulated as part of the inspection of newly produced ABB robots served as the source for detecting collective and contextual anomalies [4] [5]. Broadly speaking, the data had to support the following goals:
1. For a population of manufactured robots, could it be used to devise an automatic technique to detect anomalies by means of data-driven models?
2. For a newly manufactured robot, could it detect anomalies based on the use of historical inspection data, or of a model built on such data?
3. For a selected group or context, could it be used to detect the operational performance of manufacturing systems and equipment?
Development of a data-driven model capable of meeting these goals is indeed feasible, but the development technique varies depending on the scope of the anomaly being detected and the quality of historical data available. The effectiveness of a model in detecting an anomalous robot behavior with a high level of reliability and confidence depends on the identification of optimally synthesized normal operating thresholds.
Once a model has been developed and tuned to pinpoint anomalous behaviors in robots, data specialists can begin finding patterns in the anomalies [6] with a view to understanding the cause(s) of faults and failures. Although the next step may be the development of an automated data-driven anomaly detection and diagnosis system, developers should keep in mind that, due to the variability in anomalous behavior and associated corrective actions, such systems can quickly become extremely complex, especially if they are required to orchestrate dynamic workloads.
Broadly applicable algorithm
As an unsupervised or semi-supervised machine learning algorithm, the method developed by ABB analyzes data based on only limited knowledge and hence is applicable to a wide range of scenarios. This is indeed an important factor when it comes to anomaly detection in robot behaviors since even defining a proper notion of abnormal data is non-trivial due to the complexities involving different operations, operator errors and external factors. It is therefore paramount to develop a monitoring system that requires minimal human supervision and yet is robust enough to eliminate false positives. How can this be achieved?
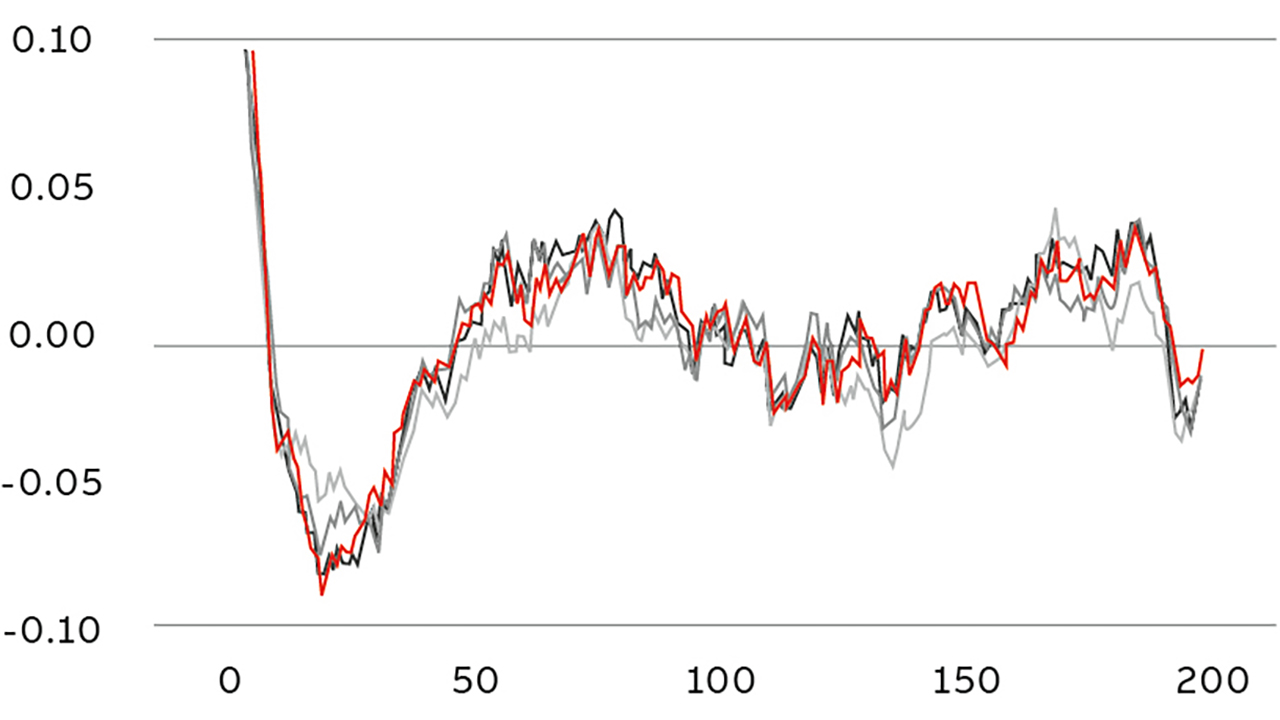
The first step was to define the data type and analyze multi-variate time series data →02, such as the signals collected from a robot’s controller, ie. those for torque, position and speed or from external sensors such as a vibration sensor.
Given the data collected during the test, the first step the algorithm must take is feature extraction from the raw time series data. This is a key step in the performance of the algorithm since many physical failures, such as backlash and high friction in motor components, become more visible in such a feature space.
The feature extraction process begins with time scale analysis on signals. This step is designed to separate slowly developing variations in component output from rapidly developing ones. This is followed by the generation of time-localized frequency components. The final set of features is then constructed by measuring the collective behavior of these components. Obviously, there are several parameters to be set for the above-mentioned steps. These parameters are computed directly from the data. Hence, the algorithm is fully autonomous.
Once the feature space has been constructed, an anomaly score for each sample is computed to identify those anomalies that deviate from the distribution →03. This is achieved by modelling a subspace covering each variation in the data through principal component analysis and then computing the distance of each sample to the subspace. The anomaly scores for each sample can be thought of as deviations from the subspace measured in terms of configurable statistical parameters.
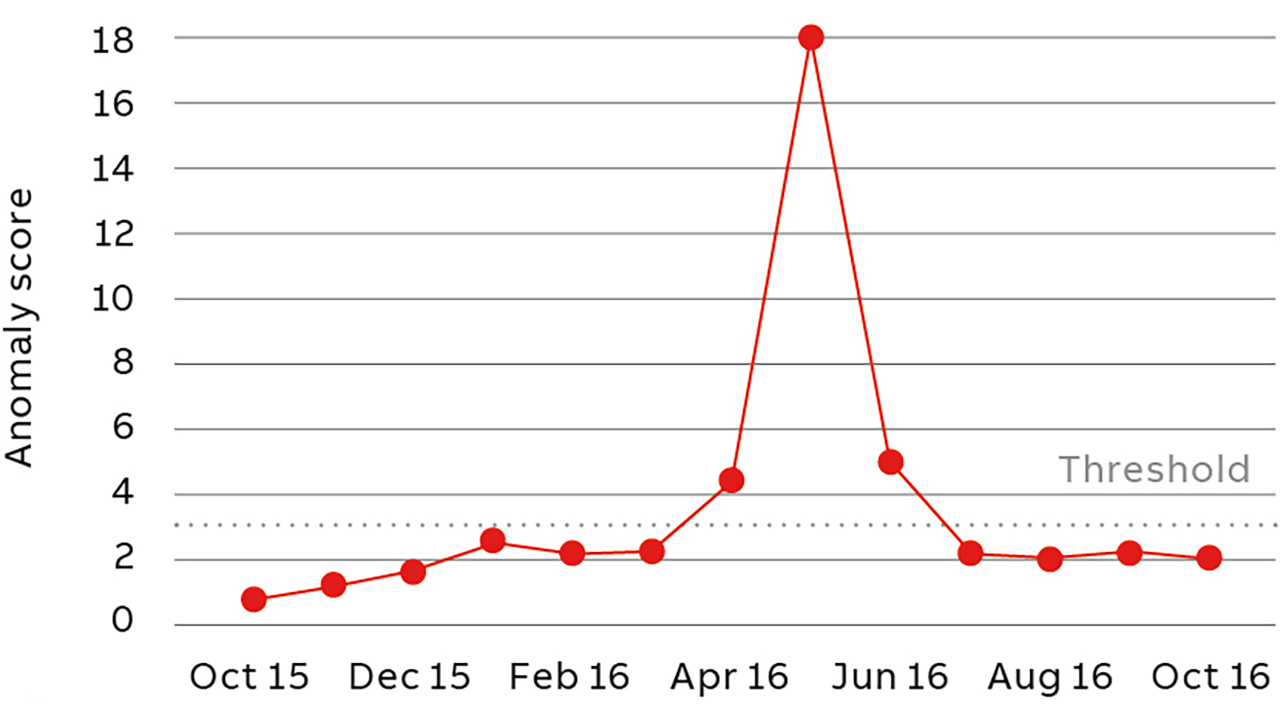
To determine the algorithm’s performance, two scenarios were considered. The first involved an examination of the quality of a robot’s operations over a period of one year during which the algorithm triggered an alarm in April 2016 when a statistical threshold was exceeded. The second was identical, with the exception that, in May 2016, the alarm was amplified to a significant value →01. Inspection of the robot in question revealed a high level of metallic particles in the oil sampled from the corresponding axis, with the particles being attributable to a completely worn-out gearbox. The gearbox was replaced in late June after which the robot’s anomaly score returned to normal values.
In the above situation, the deviation was sought in the context of assumed normal behavior on the part of the robot. The immediate question that follows is: how can a system generalize this approach to a case where the difference between normal and abnormal results is not known in advance?
One way of doing so is to improve the algorithm by adding a randomization step in which a number of subspaces are produced by the features generated from a randomly selected micro population of robots in which the deviation for each robot is calculated over all these subspaces and to which a simple voting scheme is added in order to determine whether a robot’s behaviors are abnormal or not.
The results displayed →04 over a histogram represent the distribution of deviations of the robots per axis per robot type.
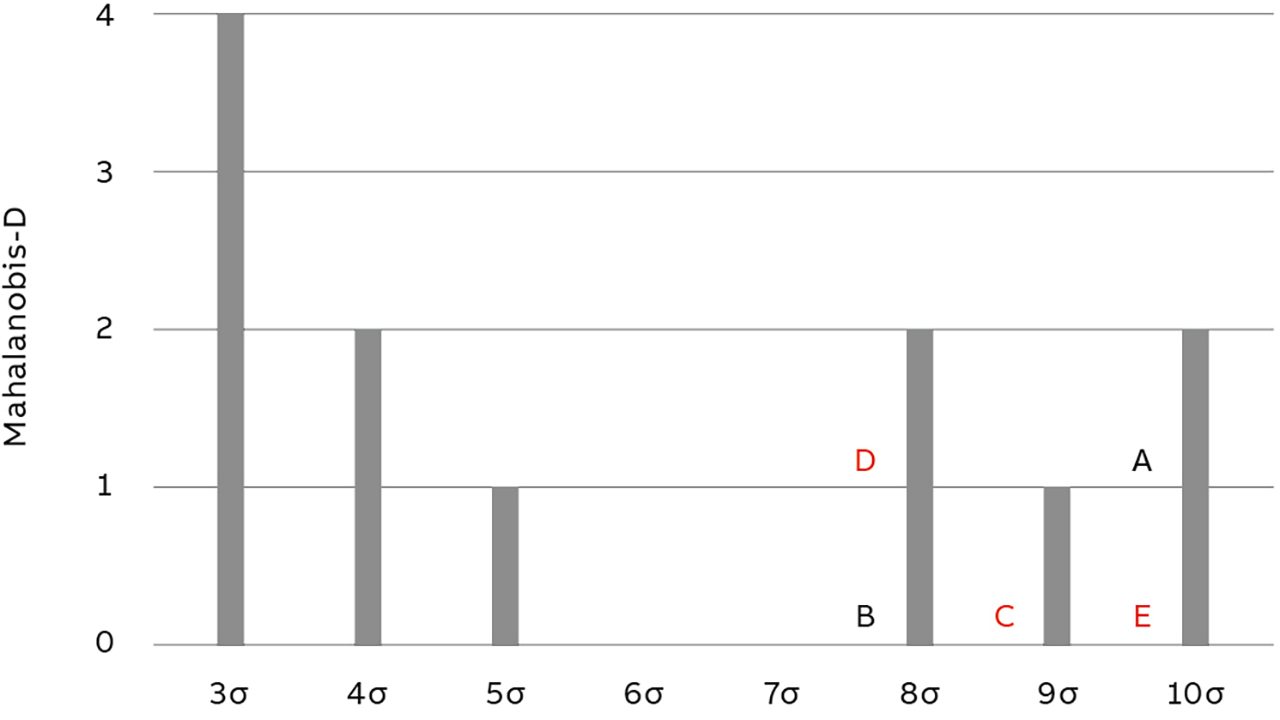
It should be noted that among these, robots A and B are known to be malfunctioning and that the algorithm identifies a further set of three abnormal robots, C, D and E, with a high level of confidence.
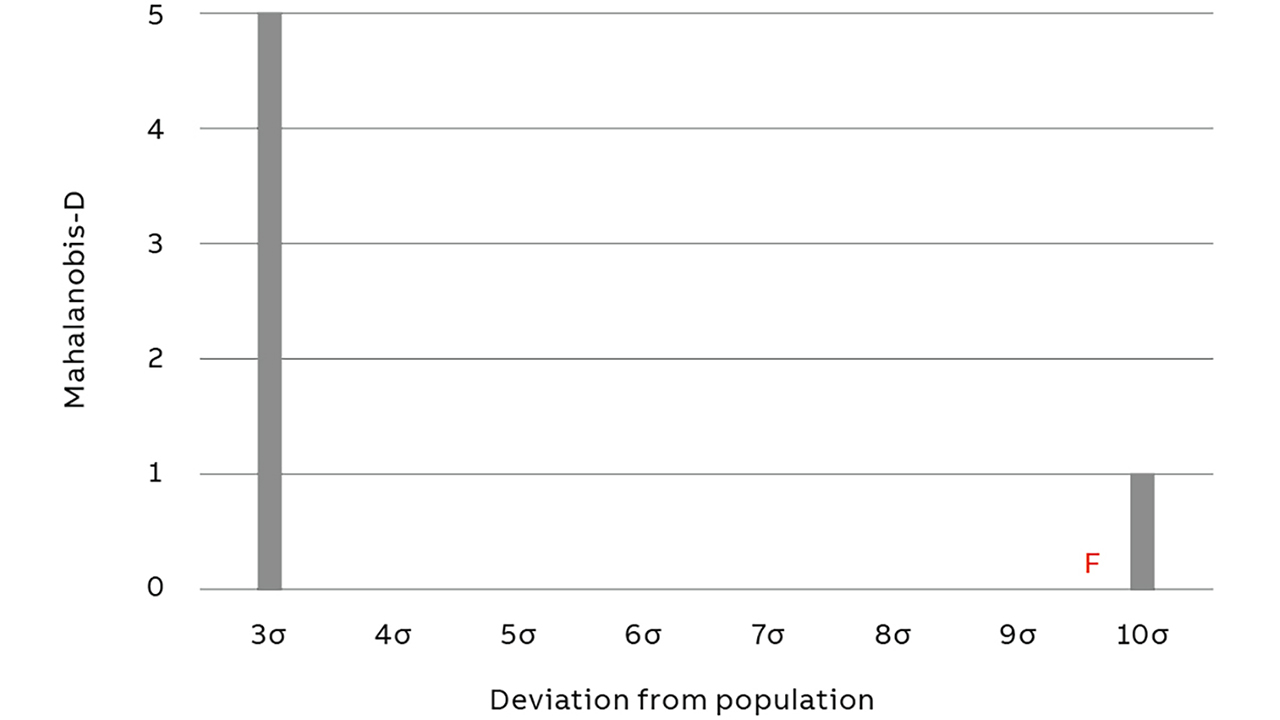
In →05, an axis from another robot type is analyzed. Here, with a high level of confidence, robot F is found to be an outlier by the algorithm, and it is verified that the robot is indeed malfunctioning.
Beyond identifying whatever is abnormal, the algorithm can be used to gain additional insights, such as, for instance, determining the relative robustness of production lines for different robot types or axes.
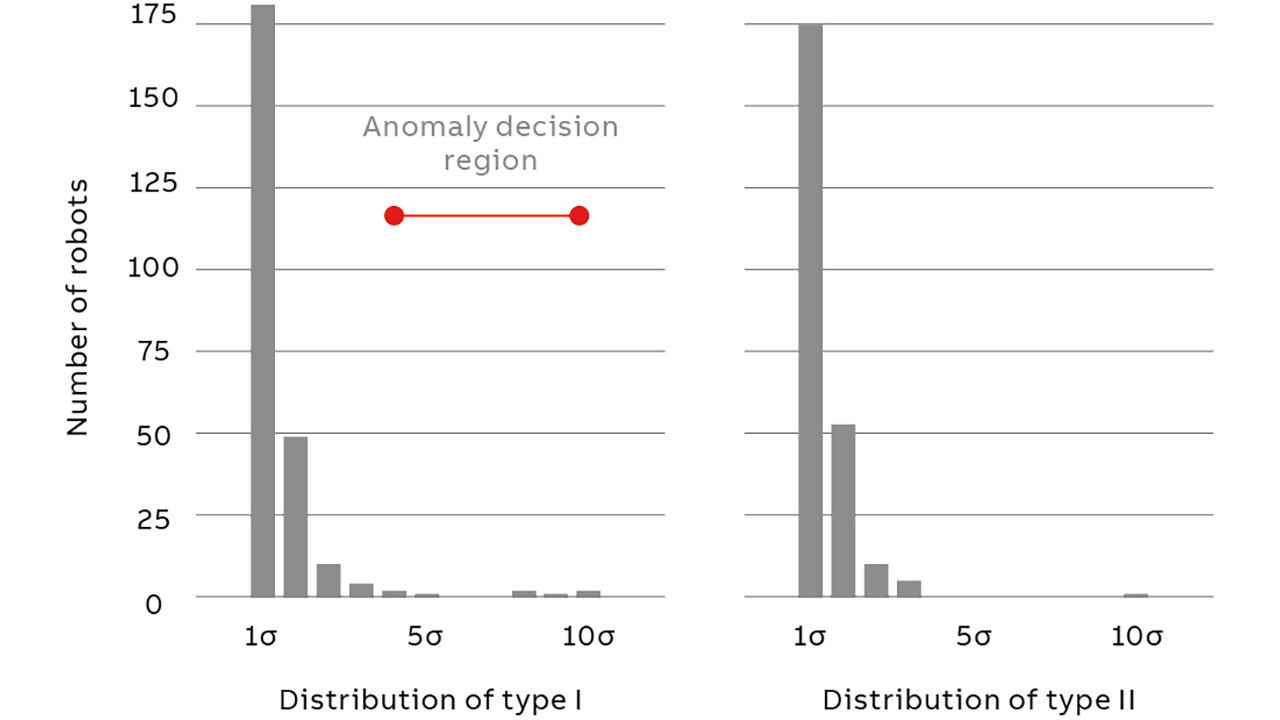
→06 displays the distribution of the whole population of robots. Here it can be observed that a significant number of robots of both Type I and Type II are in the normal range. However, the production line for Type I seems to have a slightly higher level of variation than that of Type II. Once such distributions from different types and axes are obtained, further analysis can be performed, such as correlating data with components that may be causing anomalies and failures.
However, it is worth mentioning that the production quality inspection training phase is computationally intensive and needs to be repeated hundreds of times in order to obtain a reliable production quality inspection model.
Accelerated scalability and automation
Due to the computational intensity of this phase, training the production quality inspection model for one robot type required about two days when run on a simple laptop. However, when performed using the ABB Ability™ Analytics Framework →07 it was possible to scale and parallelize the model training process, thereby reducing the execution time from days to around one hour per robot type. This enabled a more frequent model re-training for every robot type →08, thereby improving the overall model in terms of its quality inspection capabilities.

—
x
The model training pipeline runs on Azure Databricks and is orchestrated by means of Azure Data Factory. The pipeline includes the following steps:
• Collection and pre-processing of data from thousands of newly produced robots →01–02
• Training of a new machine learning model for every robot type based on the latest data →03
• Deployment of a dedicated webservice for each robot type based on individual production quality inspection models →04
It also provides visual process diagrams that make it possible to monitor performance and failover with a high level of granularity. Following the completion of its testing phase, the trained production quality inspection model was deployed as a cloud-based webservice that ensures high availability and flexibility. The service can be used via a web/mobile application →07 to either inspect a batch →05 of robots (daily production) or during ad-hoc tests directly on the shop floor →06.
The ABB Ability™ Analytics Framework thus made it possible to transition from an initial prototype to a robust service offering capable of scaling machine learning processes and saving a significant amount of time and money.
References
[1] Industrial Robotics Market Outlook – 2023 https://www.alliedmarketresearch.com/industrial-robotics-market
[2] (PDF) Testing the Performance Characteristics of Manipulating Industrial Robots. Available from: https://www.researchgate.net/publication/309713169_Testing_the_Performance_Characteristics_of_Manipulating_Industrial_Robots [accessed Feb 09 2020].
[3] ISO 9283:1998(en) Manipulating industrial robots – Performance criteria and related test methods https://www.iso.org/obp/ui/#iso:std:iso:9283:ed-2:v1:en
[4] (PDF) Anomaly Detection in Sequential Data: Principles and Case Studies. Available from: https://www.researchgate.net/publication/331353530_Anomaly_Detection_in_Sequential_Data_Principles_and_Case_Studies [accessed Feb 06 2020].
[5] Training data selection criteria for detecting failures in industrial robots https://www.researchgate.net/publication/301744877_Training_data_selection_criteria_for_detecting_failures_in_industrial_robots
[6] Anomaly Detection: Industrial Asset Insights Without Historical Data https://www.engineering.com/AdvancedManufacturing/ArticleID/19058/Anomaly-Detection-Industrial-Asset-Insights-Without-Historical-Data.aspx