Martin Hollender ABB Industrial Automation, Corporate Research Ladenburg, Germany, martin.hollender@de.abb.com
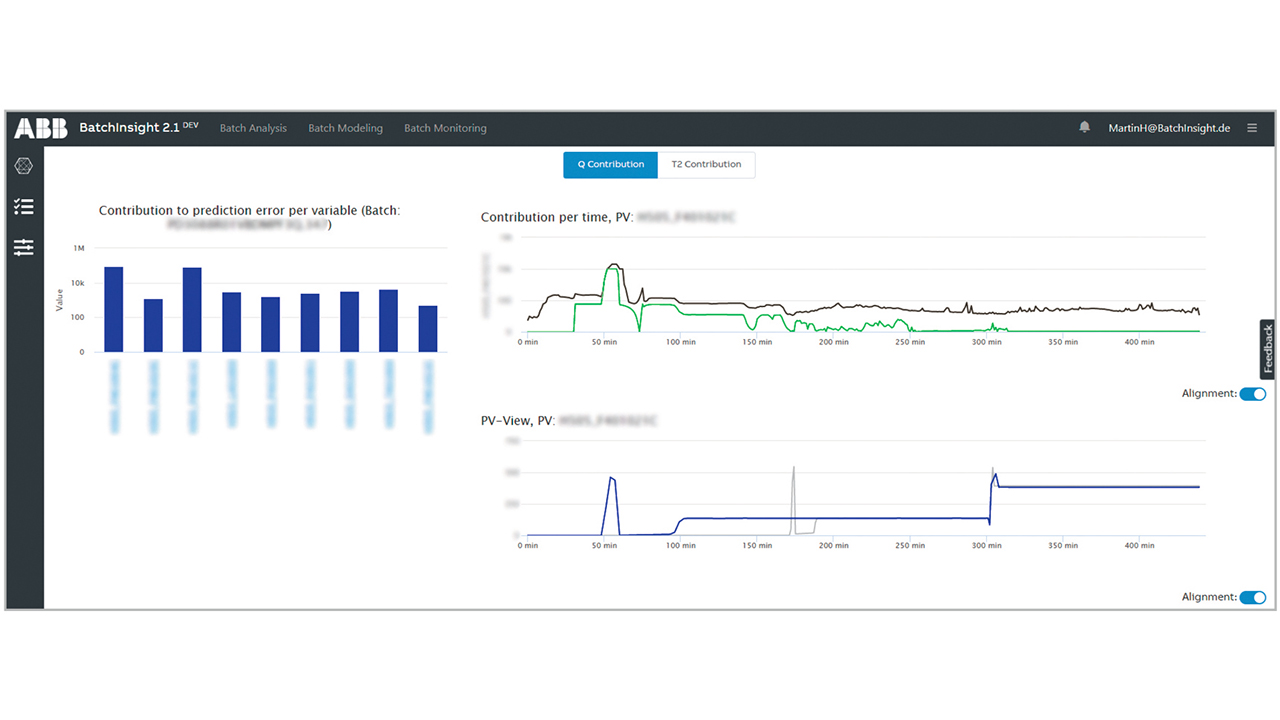
ABB, in collaboration with experienced end users at pilot customers, has developed ABB Ability™ BatchInsight, an operator support system that exploits big data to detect and troubleshoot abnormalities in a batch, both offline in retrospect and in real time.
Batch processes, though agile, are complex, dynamic and nonlinear. ABB Ability™ BatchInsight helps operators to run these processes in a smooth and trouble-free way as emerging process issues can be detected at an early stage and corrective actions taken while the batch is running.

The approach uses historical data to learn the expected behavior of the batch process under nominal conditions and builds a statistical “golden batch” model, which is then used as a reference for the batch currently under production. Deviations from this golden batch model generate a warning to the operator.

Tests were run together with the end user (a batch chemical plant) with historical batch data emulating an online approach (meaning data for the current batch was only available until the current step). A multiway principal component analysis (MPCA) model was used to detect a foaming problem that occurred in a fraction of the batches. The model was trained only with batches without foaming. In 83 percent of the cases, the system was able to predict a foaming event at least 5 mins before it occurred. Often it predicted the foaming hours before. Although foaming was wrongly predicted in 20 percent of the cases, the predictions are very helpful as the operator can then focus on suspect batches.
