Andreas Blaszczyk, Thomas Christen, Patrik Kaufmann Former ABB employees; Christoph Winkelman ABB Corporate Research Baden-Dättwil, Switzerland, christoph.winkelmann@ch.abb.com; Pouria Homayonifar ABB Electrification Skien, Norway, pouria.homayonifar@no.abb.com; Atle Pedersen SINTEF Energy Research, Trondheim, Norway
Dielectric dimensioning is a crucial aspect of the development of medium- and high-voltage devices like switchgear, cable accessories and transformers. When introducing a new device to the market, manufacturers are obliged to certify the product by performing a series of dielectric type tests defined by technical standards. A test is successful if the electric insulation of the device can withstand AC and lightning impulse (LI) electric field stresses without breakdown. The prediction of test results is typically supported by electrostatic field computations that are compared with the critical values specified for the given materials such as gases, liquids and solids, and interfaces between them. However, this obvious approach is, in many cases, insufficient because dielectric failures do not have a simple relation to field strengths.

The ABB simulation tool VHVLab provides a software framework focused on the prediction of dielectric test results and is aimed at closing the gap between numerical computations and experiments →01 – 02. VHVLab’s predictions are achieved by combining engineering simulations with empirical knowledge obtained from experiments and first-principle simulations of microscopic models. This type of software is not available commercially because the simulation procedures integrated into VHVLab are derived from ABB test experience gained in a real HV laboratory. Such a tailored platform is a competitive differentiator to commercial simulation software and allows for faster design loops. The development of VHVLab has been driven by industrial research supported by specialized academic partners.
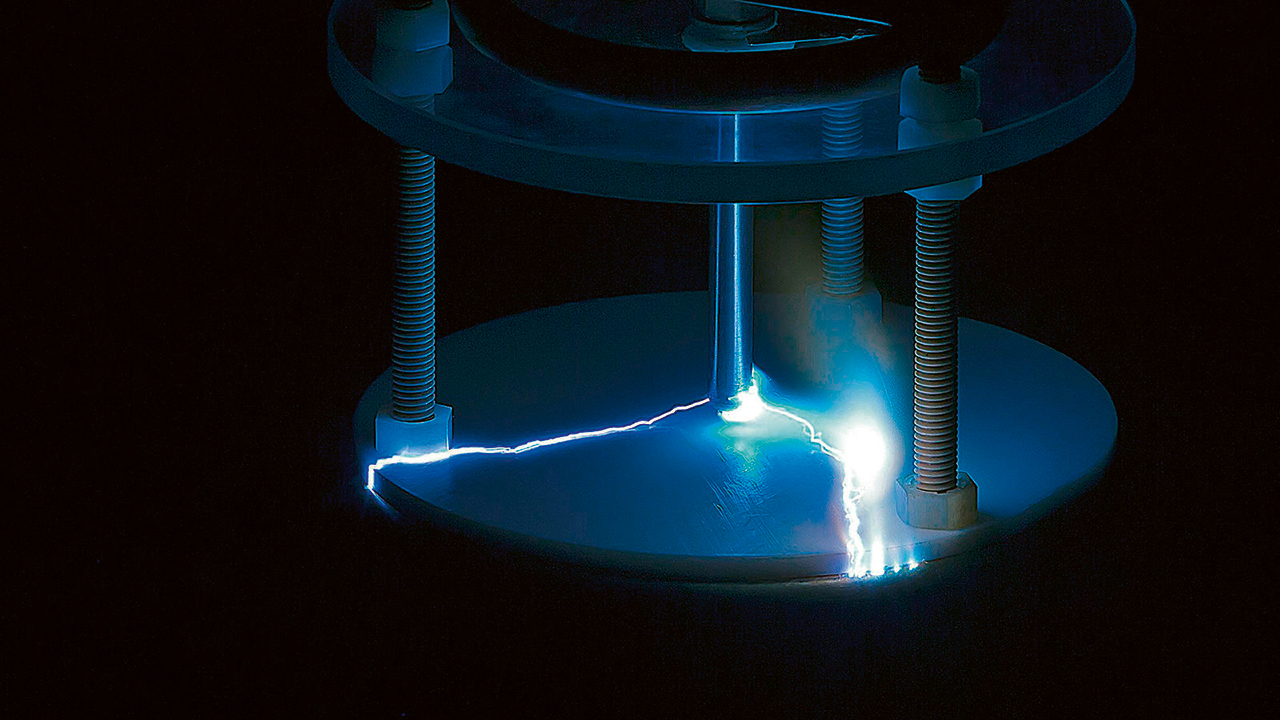
This article presents a short description of the VHVLab architecture, followed by a collection of case studies originating from the development of an eco-efficient medium-voltage load break switch [1]. Each study deals with a different simulation procedure, covering features such as streamer inception, sharp edges, triple points and surface charging.
VHVLab architecture
The core component of VHVLab, which includes discharge modeling, is connected via predefined interfaces with two external components: the visualizer and the background field solver →03. This open structure enables the integration of any arbitrary external software component. The preferred choices here are an in-house, electrostatic boundary element method (BEM) solver – used in ABB since the 1990s for dielectric simulations [2] – and a customized implementation of ParaView, a well-established, freely accessible scientific visualizer.
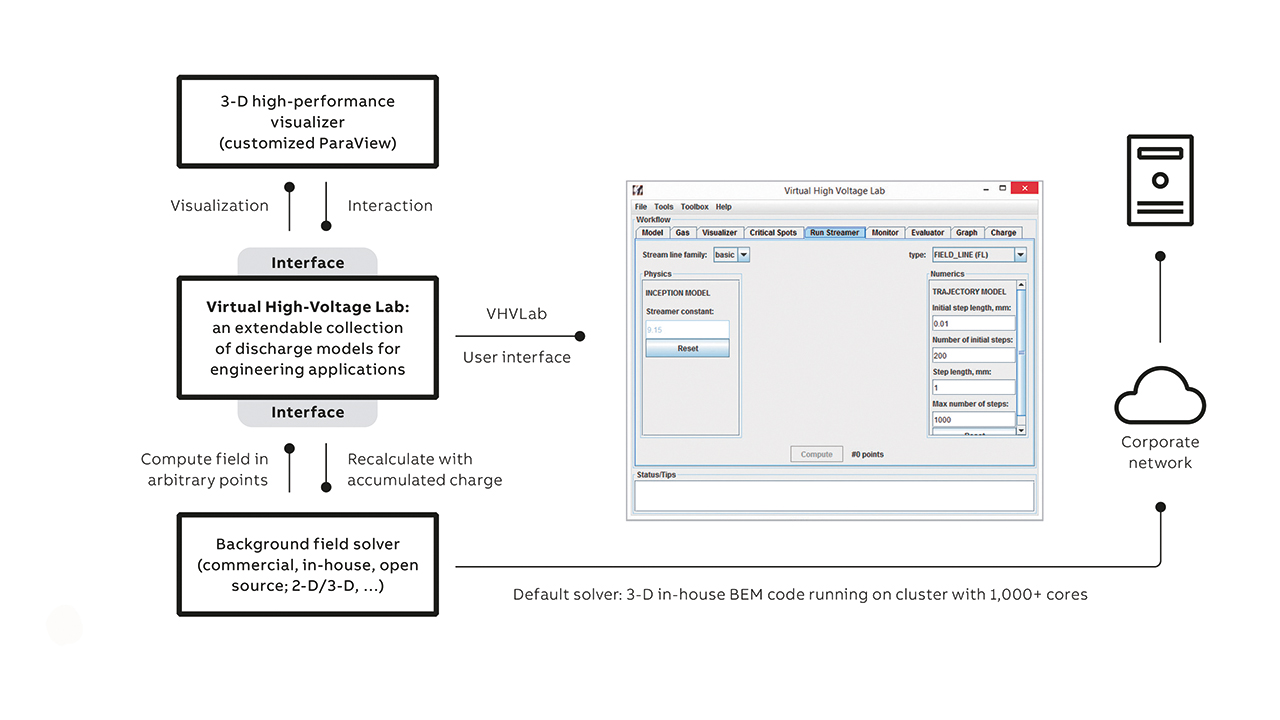
The VHVLab core module is implemented as a Java application that includes a graphical user interface to guide the ABB engineer through the discharge evaluation.
The workflow is:
1. Load the initial background field solution, calculated prior to the VHVLab session.
2. Specify the surface roughness and the gas properties: pressure, temperature, gas type, mixture composition, etc. Based on the specified data, the critical stress above which a discharge can be initiated is evaluated by VHVLab.
3. Compute critical spots where discharge inception can occur and select points for further evaluation.
4. Specify parameters for the calculation of inception and discharge paths.
5. Start and monitor computations.
6. Evaluate inception results for all selected and calculated points.
7. Enable visualization of graphs with field characteristics along computed discharge streamlines.
8. Define surface-charge boundary conditions and compute the background field with surface charge. Return then to step 3 until the evaluation has reached a satisfactory degree.
Results are illustrated in the following case studies.
Streamer inception
Inception of a gas discharge in an electric field starts with the appearance of the first free electron from which a Townsend avalanche is initiated. If a critical number of electrons are generated, a self-propagating streamer head forms. This streamer inception criterion is contingent on the field-dependent effective ionization coefficient, which accounts for impact ionization and electron attachment and detachment. The value of the inception voltage is calculated iteratively by changing the applied voltage and scaling the electric field values along a discharge path until the criteria for inception are met.
One of the first applications of the streamer inception models implemented within the VHVLab framework was for a new air-insulated 12 kV switchgear application. A replacement of SF₆ by pressurized air, while keeping the same size of compartments and insulation integrity, was the main design challenge, which could be solved only with intensive support by simulations for shape optimizations. Interestingly, the design that was obtained could also fulfill the requirements of 24 kV switchgear by using ABB’s AirPlus (air mixed with fluorinated ketones) as the insulating gas. For both ratings, VHVLab was able to predict an inception voltage that passed the LI tests. →04 shows an evaluation of streamer inception voltage and test results for a ring main unit disconnector. A difference of around 10 percent between the measured withstand and simulated inception voltages is typical for prediction of LI test results and is assumed by engineers as a safety margin.
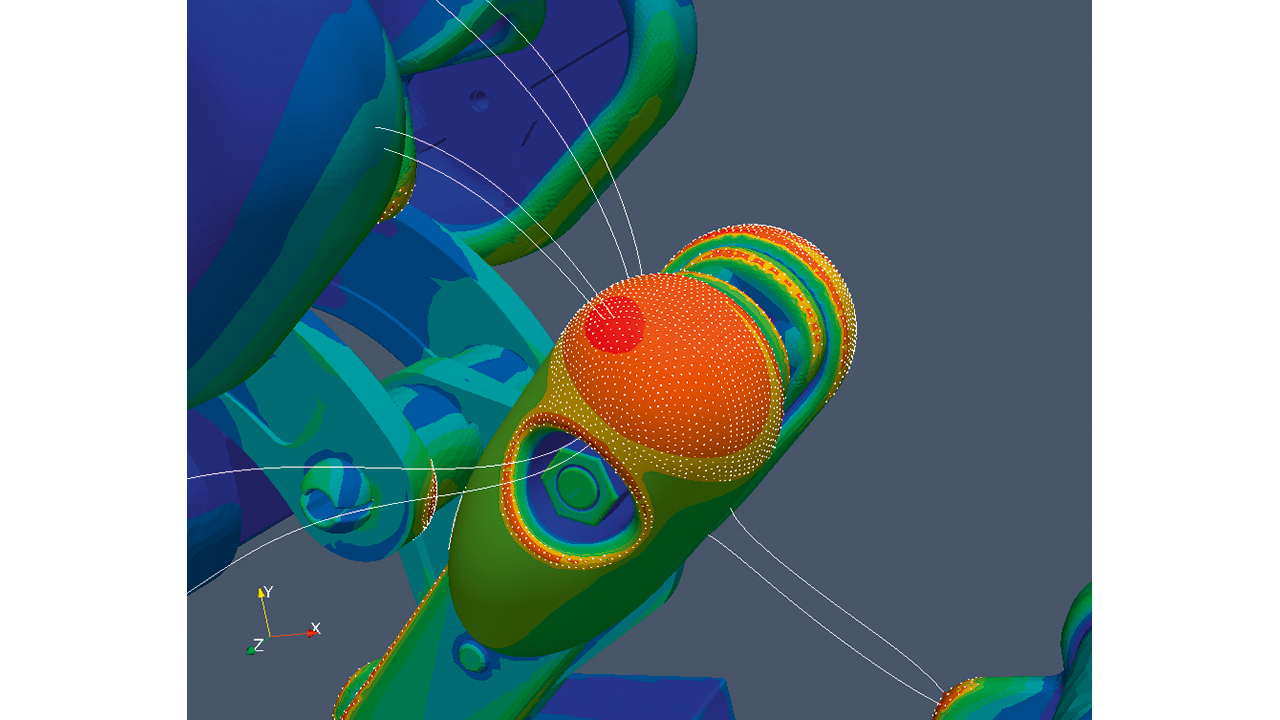
04a Electric field strength at 125 kV LI and field lines calculated for critical spots (lighter colors/dots show areas more liable to discharges). 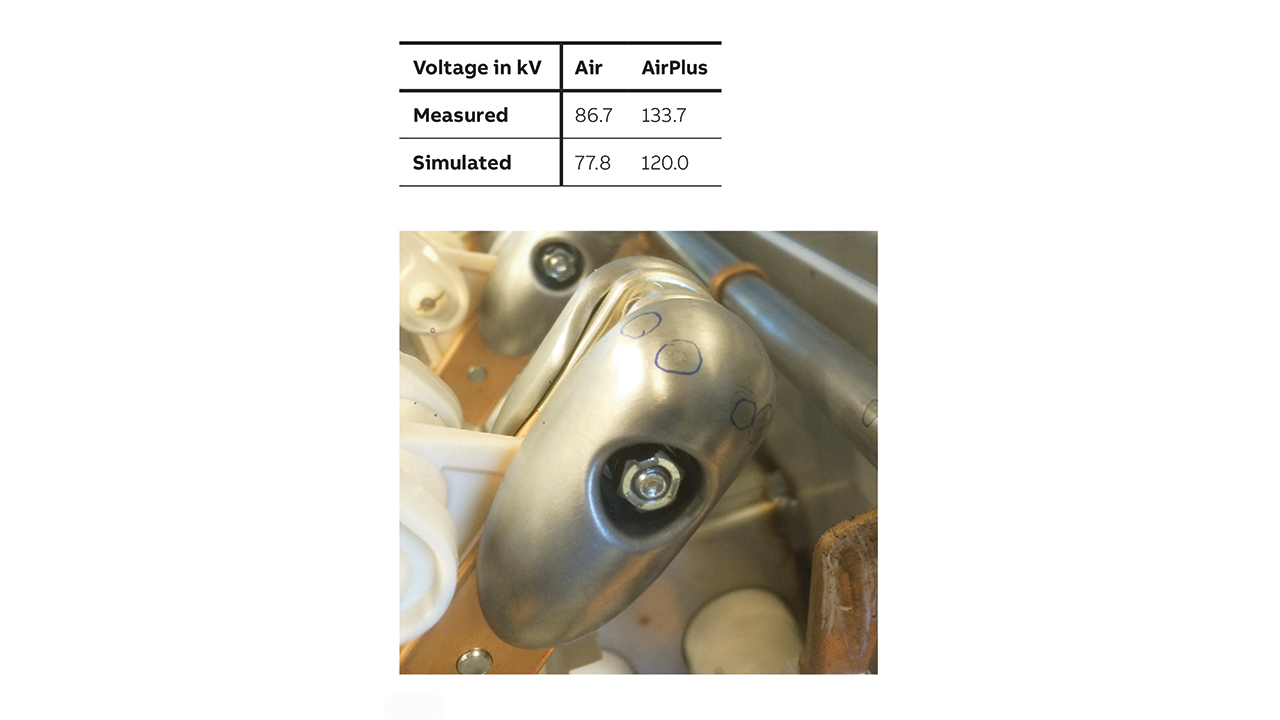
04b Traces of discharge on the surface of a knife shield after LI test.
04 Evaluation of streamer inception voltage and test results for a ring main unit disconnector.
Sharp edges
Field enhancements around sharp edges are well-known sources of LI test failures in medium-voltage switchgear, and recent trends to reduce device sizes – and thus clearances, ie, the shortest distance through the gas between two stressed electrodes – exacerbate the situation. An ABB research project using VHVLab investigated how the sharpness of electrodes influences the withstand voltage [3]. One of the results clearly shows a relation between the rounding radius of the sharp edge and the experimental withstand voltage, which decreases with the increasing sharpness of the edge →05. Breakdown is a stochastic process and multiple tests deliver a probability distribution that allows a voltage to be estimated at which the probability of breakdown is 2 percent or 50 percent. Furthermore, it was confirmed that the simulation, based on inception criteria, agrees well with experiment. The study was limited in scope to one aspect of sharp edges: short distances, ie, reduced clearances, which are typical in compact switchgear designs; for long distances in air, sharpness does not matter.
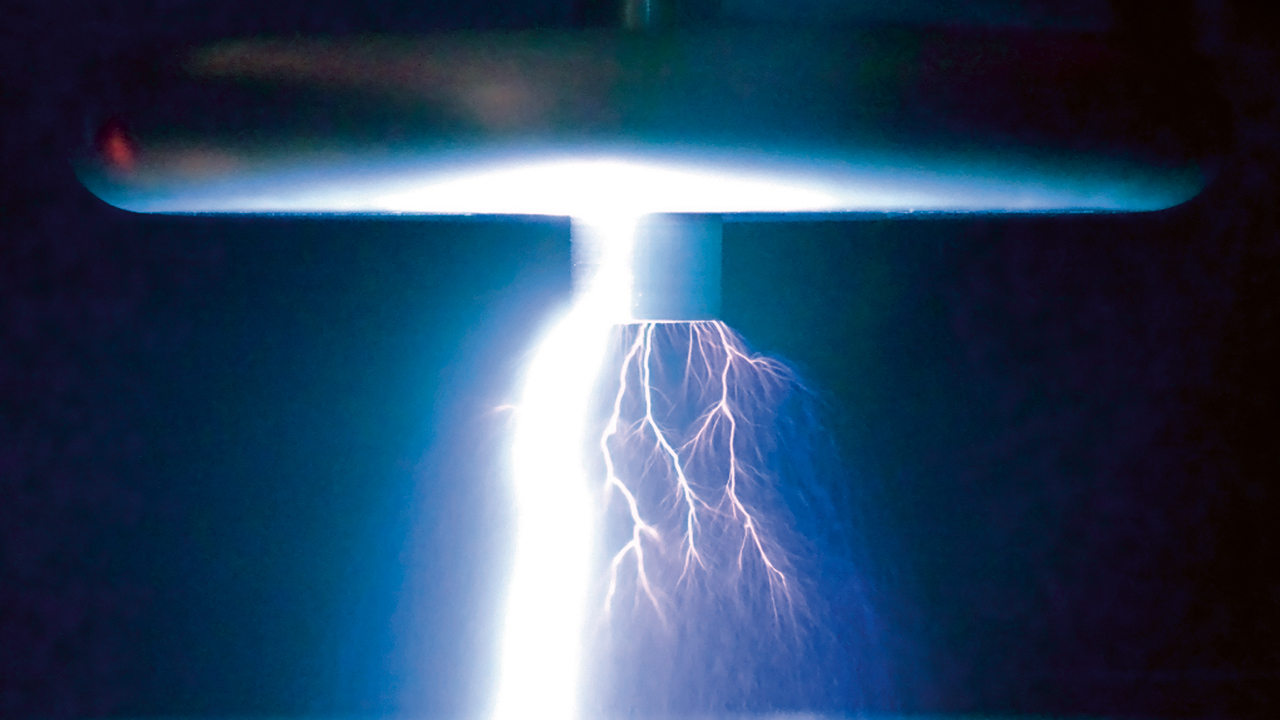
05a Test arrangement with a breakdown after applying a positive lightning impulse. The exposed electrode is a cylinder with rounded or chamfered edge. 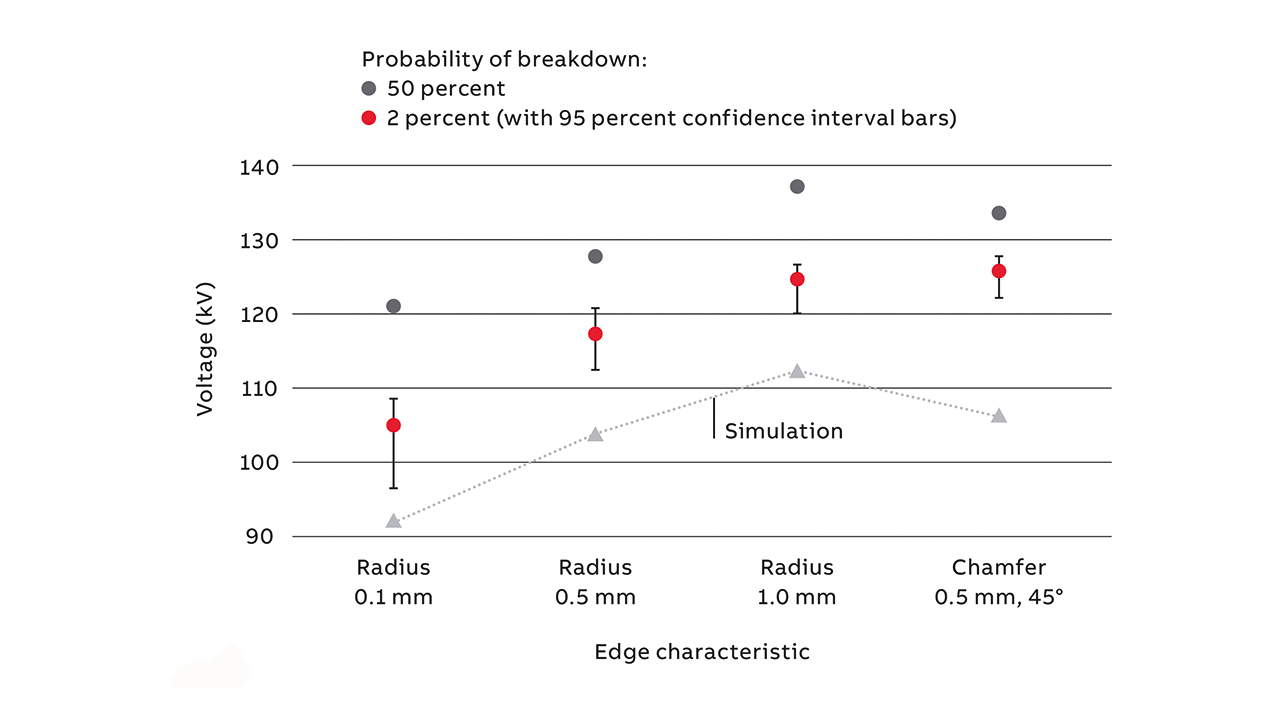
05b Comparison of measured breakdown/withstand voltages and the simulated inception.
05 Results of sharp-edge experiments and simulations in atmospheric air [5].
→06 shows an application of sharp-edge simulations for a recently designed SF₆-free load break switch. The inception values calculated for critical spots A and B are 75 kV and 68 kV, respectively, and are confirmed by 75 kV LI tests in air: there is no breakdown at spot A, but failures occurred at spots B for this initial design variant.
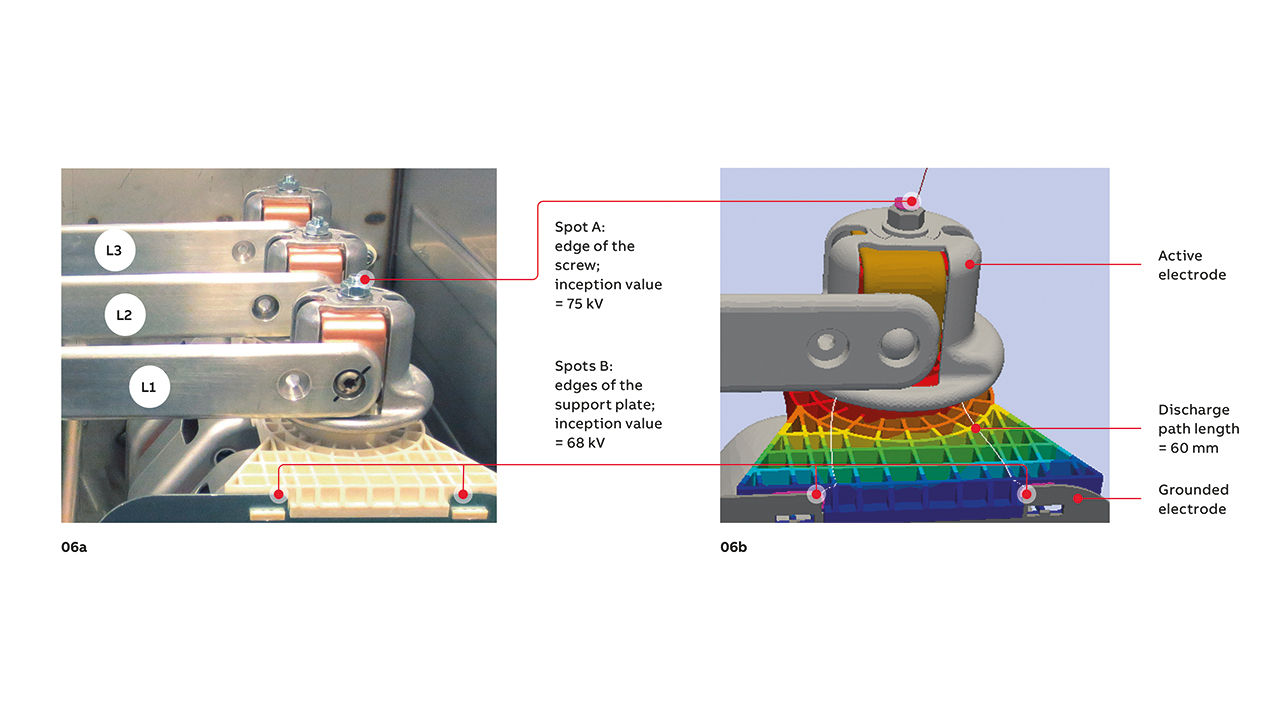
06 Sharp-edge evaluation examples in a compartment of 12 kV gas-insulated switchgear (air, 1.3 bar).
Triple points
The triple point is the junction in switchgear of metal, solid dielectric and gas, and is the most likely location for electron emission in the presence of a high electric field. The triple point is also a prime location to initiate flashover or breakdown. In the development of the 12 kV switchgear in →04, triple-point problems were encountered during AC dielectric tests on the mechanical bushing, which consists of an insulating shaft mechanically connecting the grounded drive with the rotating disconnector that operates under high voltage →07a.
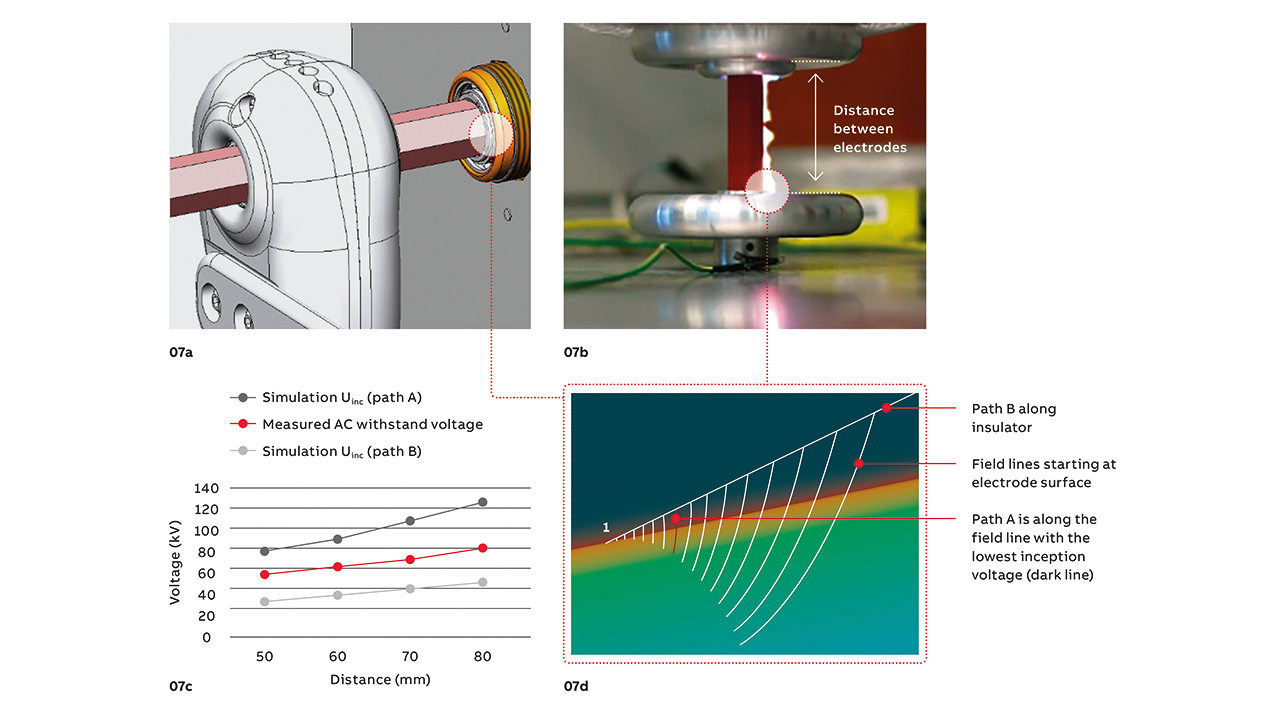
07 Triple-point analysis.
To assist ABB in investigating the dielectric performance of such a configuration in air, researchers from SINTEF built an experimental setup that enables a flexible choice of triple-point configurations [4] →07b. The relationship between the measured AC withstand voltage (estimated statistically as the average breakdown voltage reduced by two standard deviations) and the electrode separation shown in →07c, is one example of an experimental result for a selected shape of the grounded electrode mounted around the insulating shaft.
The simulation of inception at triple points is not straightforward due to a very specific field distribution existing in the narrow space between the solid dielectric and the electrode. An evaluation of streamer inception criteria can be performed for several variants of discharge path and using different field strength components for determination of ionization coefficients →07d. Although this type of simulation can properly reproduce the trends observed in experiments, the simulated values of inception voltage differ from those measured. According to the current VHVLab guidelines, engineers can select any of the proposed evaluation variants. These variants all ensure a conservative prediction but the safety margin is not well defined. This situation indicates that breakdowns caused by triple-points require further investigation that focuses not only on inception models, but also on other influences such as surface charging, polarity changes, roughness and trapped particles.
Insulator surfaces and charging
Interaction of discharges with dielectric surfaces – eg, electrodeless streamer inception, discharge creep along surfaces and surface charge accumulation – are of great relevance for practical applications. Over the last decade, ABB has collaborated with academic partners in these areas [5,6].
One example of discharge interaction applicable to engineering simulations integrated into VHVLab involves saturation charge, which can be considered as a boundary condition prescribed in an electrostatic field computation. Saturation charge is interpreted as the maximum possible surface charge that can be accumulated on a dielectric surface by a discharge. Experiments and first-principle simulations confirmed the concept and nature of saturation charge, in particular its ability to suppress subsequent streamer inception and prevent breakdown for LI tests [6]. An implementation included within the VHVLab framework made it possible to compute surface charge effects in devices with highly complex 3-D geometry in a straightforward way. An attractive feature offered by surface charge analysis is a quantitative explanation of why some devices can pass the LI test, although calculations that neglect surface charging predict a breakdown [7].
VHVLab – future developments
VHVLab is a useful simulation framework for medium-voltage switchgear that can be used by nonexperts. Fast and structured design iterations can be achieved as an intrinsic part of the development workflow and dependency on the availability of labs and physical test variants is reduced. Still, VHVLab does not offer a fully automatic virtual test where a discharge can be simulated and visualized by pushing a button. However, the tool makes a first step in this direction by offering a collection of numerical procedures and empirical rules that allow engineers to evaluate, visualize and understand discharge phenomena. In this context, VHVLab is not only an engineering tool but also a knowledge database into which the experience of researchers and developers has been gathered, providing a foundation for future digital testing.
Acknowledgment
The authors would like to thank colleagues from ABB Corporate Research, ABB Electrification Technology Centers, TU Munich, ETH Zurich, TU Eindhoven, CWI Amsterdam, University of Tartu, Estonia, HSR Rapperswil, Switzerland, and NTNU and SINTEF – both in Trondheim – for their contributions to the development of VHVLab.
References
[1] E. Attar, et al., “SF6-Free Puffer Type Load Break Switch for Medium Voltage Applications,” ABB Review, 2/2021, pp. 72– 77.
[2] A. Blaszczyk et al., “Net value! Low cost, high-performance computing via the Intranet,” ABB Review, 1/2002, pp. 35 – 42.
[3] P. Simka et al., “Air breakdown at sharp edges,” IEEE 2nd International Conference on Dielectrics (ICD), IEEExplore, Budapest 2018, pp. 885 – 888.
[4] N. S. Stoa-Aanensen, “Initial testing of breakdown voltage, 50 Hz stresses on triple junction setup,” Report AN 15.14.64 SINTEF Energy Research, Trondheim, 2015.
[5] A. Chvyreva et al., “Raether-Meek criterion for prediction of electrodeless discharge inception on a dielectric surface in different gasses,” Journal of Physics D: Applied Physics 51, pp. 1 – 11, 2018.
[6] H. K. Meyer et al., “Surface charging of dielectric barriers in short rod-plane air gaps. Experiments and simulations,” IEEE Conference on High-voltage Engineering and Application, ICHVE 2018, Greece.
[7] A. Blaszczyk et al., “Surface Charging Models for Prediction of Withstand Voltage in Medium Voltage Range,” Proceedings of 19th Conference on Electromagnetic Field Computations (CEFC), Pisa, November 2020.
