Jinendra Gugaliya Former ABB employee; Will Leonard ABB Energy Industries Cambridge, United Kingdom, will.leonard@gb.abb.com; Peter Damer ABB Energy Industries St Neots, United Kingdom, peter.damer@gb.abb.com; Maurizio Barabino ABB Energy Industries Genoa, Italy, maurizio.barabino@it.abb.com
Process industries such as refineries, cement- and power plants, etc., rely on a multitude of crucial equipment such as motors, pumps, fans, compressors, turbines etc., running around-the-clock, to ensure smooth production. Keeping these machines at peak health is critical as wear-and-tear is inevitable and machine failure undesirable. This is typically accomplished through planned maintenance in which certain spare parts are replaced and lubricants are applied to the rotating parts etc., on schedule or through reactive-, or unplanned maintenance, in which machines are serviced only once they fail – a costly endeavor [1,2]. For instance, a recent ARC survey found that companies loose between 3 and 5 percent of their production to unplanned downtime [2]. Just a 1 percent gain in asset utilization could easily yield several millions of dollars in additional revenue [2]. Additionally, energy businesses spend about 40 percent of their operational expenses on both planned and unplanned maintenance – only to cover 20 percent of their assets [2]. Clearly, planned maintenance has advantages over reactive maintenance, because running machines to failure can not only result in an unplanned plant shutdown it can seriously compromise the safety of personnel, equipment and the environment [3,4].
With the onset of Industry 4.0, advances in digital technology, machine learning (ML) and cloud and edge computing, a new paradigm for asset health maintenance is emerging and ABB is at the vanguard of this genesis. Nowadays, assets are highly digitalized so that critical sensor measurements generate vast streams of data. Advanced analytics can be used to discover just when the asset needs maintenance. This sensible data-driven-approach to asset maintenance, the predictive maintenance approach, opens up a world of cost efficiency as it is based on actual real-time asset health. Industry must no longer choose between running a machine to failure or replacing parts that are perfectly fine; maintenance can be forecast and optimized.
Predictive maintenance: the ends and outs
Predictive maintenance can add value to production processes by improving efficiency and lowering the need for unplanned maintenance and redundancy; thereby reducing costs [1]. In process industries, utilizing this approach can reduce downtime between 30 and 50 percent and extend equipment lifetime between 20 and 40 percent [1].
For the successful adoption of a predictive maintenance strategy, the early detection and identification of incipient faults is a prerequisite. This necessitates equipment inspection and early warnings for investigation of potential causes of faults that might develop.
Truly forecasting maintenance is not straight-forward. To effectively schedule maintenance, it is necessary to predict how a detected abnormal condition is likely to develop in the future. Only then can valuable insight into the probable future consequences be gained [1]. Thus, successful predictive maintenance requires a three-pronged process:
• Condition monitoring that can provide early detection of faults
• Identification of specific failure mode(s) related to the fault detection
• Quantification of the extent of fault development to support maintenance planning
Despite the availability of various popular ML approaches to develop models for asset condition, eg, Principal Component Analysis (PCA), K-Nearest Neighbor (KNN), Local Outlier Factor (LOF), One Class Support Vector Machine (OCSVM) etc. [5], ML approaches are black box approaches and fully dependant on asset data; they make no assumptions about the asset or its failure modes.
Practical industrial experiences indicate that such approaches are not always successful; often lead to several types and, or, several instances of the same type of false positives; and false negatives. Raising an alarm when the asset is completely healthy or vice versa; this can increase unplanned and redundant costs, decreasing viability [6].
To circumvent such unwanted consequences, ABB proposes the use of a robust hybrid approach; one that utilizes ML models and Failure Modes and Effect Analysis (FMEA) of the asset to provide accurate information about actual asset health.
ABB’s innovative hybrid approach
ABB’s hybrid approach relies on historical data and engineering models of an asset to enable the implementation of predictive maintenance. Here, online condition monitoring combined with data science uses one of two techniques:
• Detection of anomalies where online measurements deviate from normal operating behavior
• Identification of known failure characteristics where online measurements closely match a “fault signature”
Both techniques use a data model: the former represents “good health” and the latter captures the “data signature” present under fault conditions. Given that these two techniques are essentially the corollary of one another, it is natural to conclude that they may be equally useful. Practically, however, the former is often the best approach because there is almost always sufficient historical data available that represents good health. This health data enables the model to be trained. Conversely, there is usually no- or insufficient data available to represent all possible failure conditions; thereby obviating the ability to train the model.
Additionally, the latter model relies on equipment characteristics, as observed in the data; and these depend on the installation and operating conditions. Thus, data that relates to a specific machine is usually insufficient to train an accurate fault model.
With the hybrid approach, an engineering model is used to quantify the extent of the deviation of the online measurements from the health model. A Failure Mode Analysis model is used. Commonly referred to as a Failure Mode and Effect Analysis, or FMEA, this technique is a core component of Reliability Centered Maintenance (RCM) programs. Because models already exist for the most commonly encountered equipment and systems, this technique is advantageous. FMEA, incorporates the means (through observation) to define the potential detection and identification of a fault. Where such detection is enabled through online sensor measurement, prediction of failure is possible.
Three steps to success: the hybrid approach process
ABB’s scientists have proposed a new three-step process for an asset health configuration:
1) Define the engineering model by defining failure modes and associated measurements.
2) Train the data model on historical data.
3) Deploy the model.
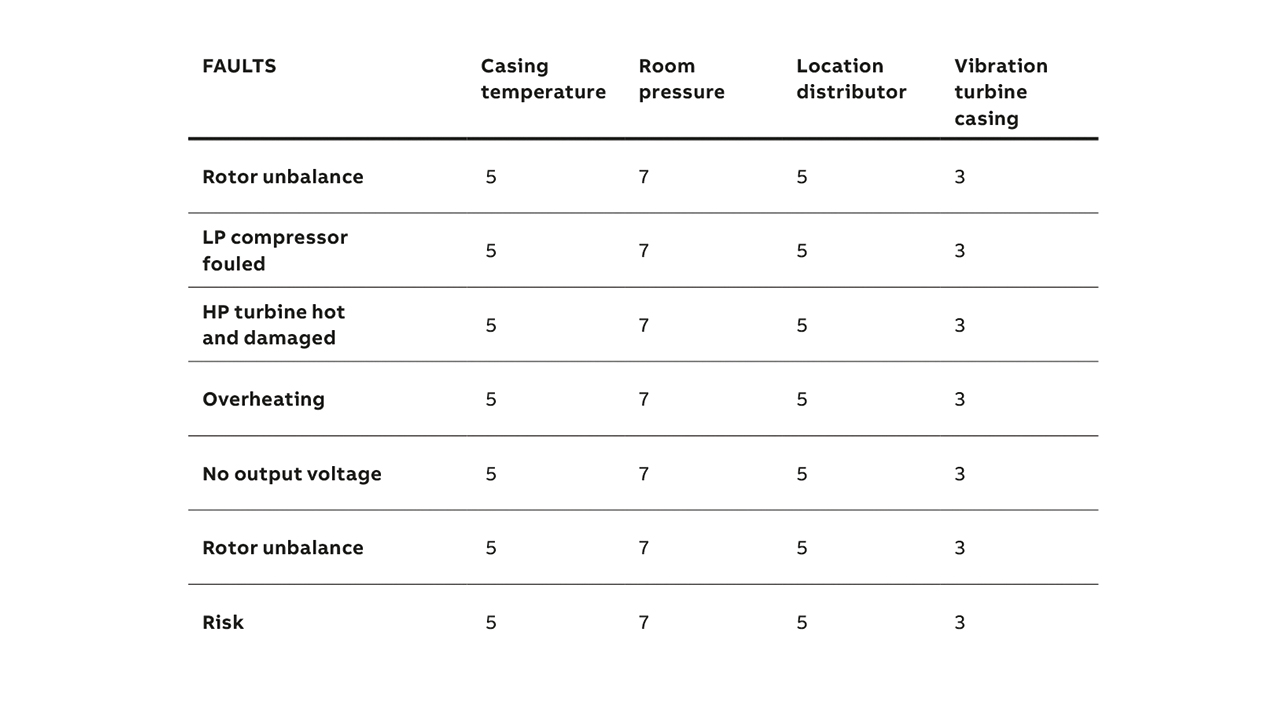
In step 1, the association between failure modes and associated measurements is captured as a set of weights. A non-zero weight indicates that the fault is observable in anomalous values of the measurement, and the magnitude of the weight reflects the relative strength of the observation relative to the other measurements →01.
Historical data is used to train the health data model in step 2. Selected data reflects the equipment operating in a health condition, and across all operating conditions. The training uses several statistical and ML methods to derive a compressed model suitable for real-time calculation.
In step 3, the trained models are then deployed. Such models take data from the asset at regular intervals, eg, one minute, and provide information about asset health; eg, how likely would the condition lead to failure mode.
How does the hybrid model work?
Relying on both data and fault analysis models, the hybrid approach generates indicators for predictive maintenance: Key Diagnostic Indicator (KDI) →02 and fault indicators. First, for each measurement in each model a KDI is calculated by comparing the deviation of the measured value from the “expected” reference value. The reference value is derived by searching the entire data for the closest fit to the current conditions. An ML algorithm such as KNN is used to efficiently compute the nearest neighbor.
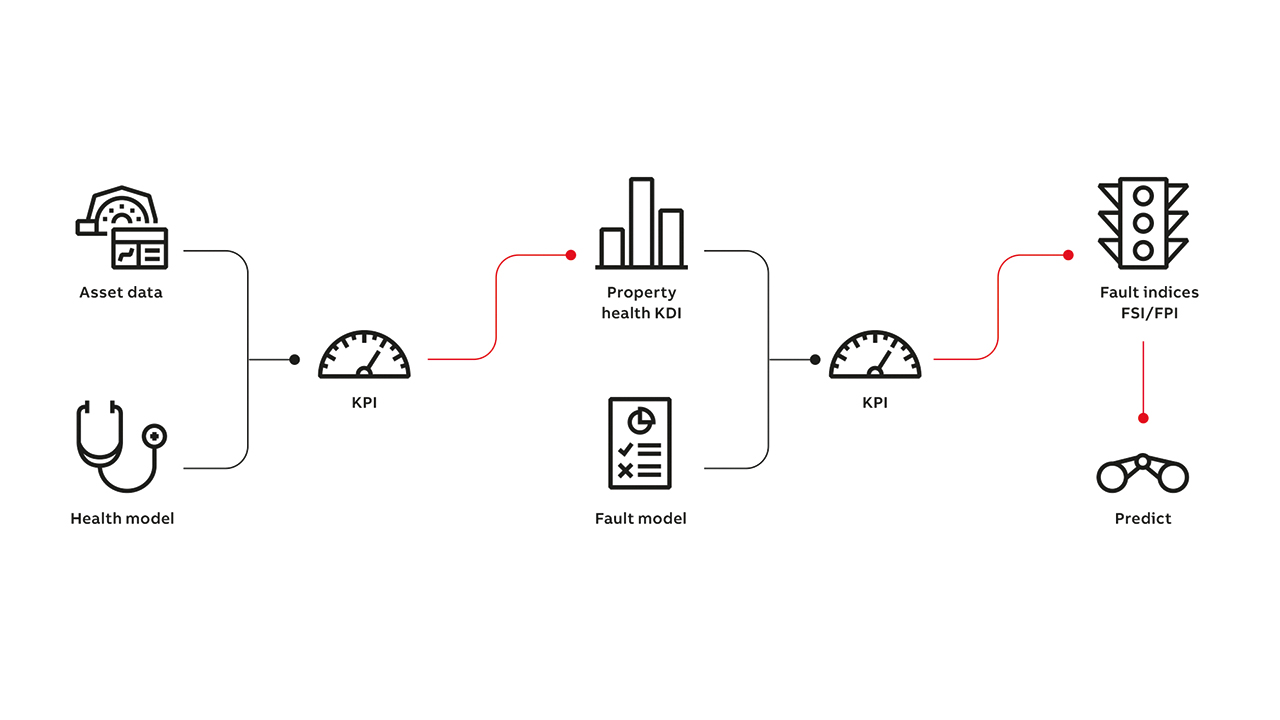
All KDI’s are expressed as a percentage; thereby allowing the user to easily interpret the value, irrespective of model, measured quantity or range. It is noteworthy that although a singular value, the KDI calculation uses a multivariate technique such that the closest fit considers all measurements defined for the model →02 – 03.
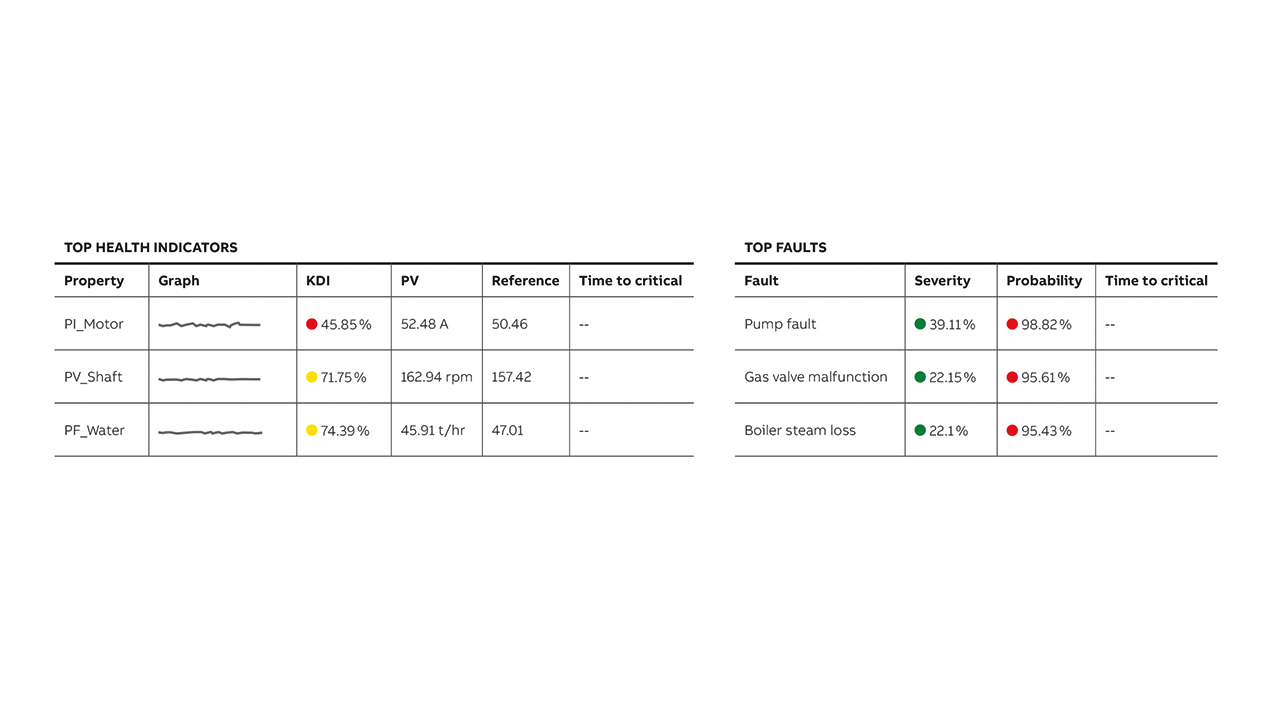
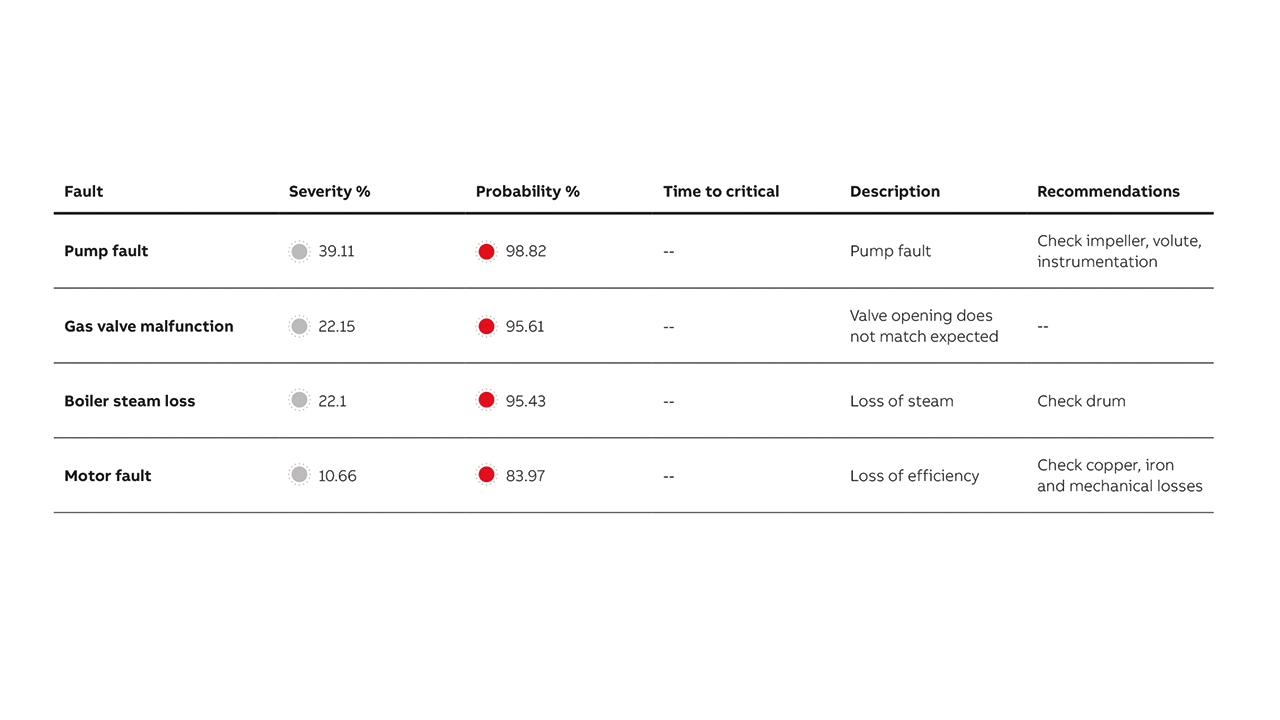
Second, fault indicators →02: Fault Probability Indicator (FPI) and Fault Severity Indicator (FSI) are calculated for every fault →03. The calculation represents an aggregation of the deviations of all the weighted measurements. The aggregation calculation differs to provide a distinction between severity and probability based on the relative distribution of deviation across all the measurements →03.
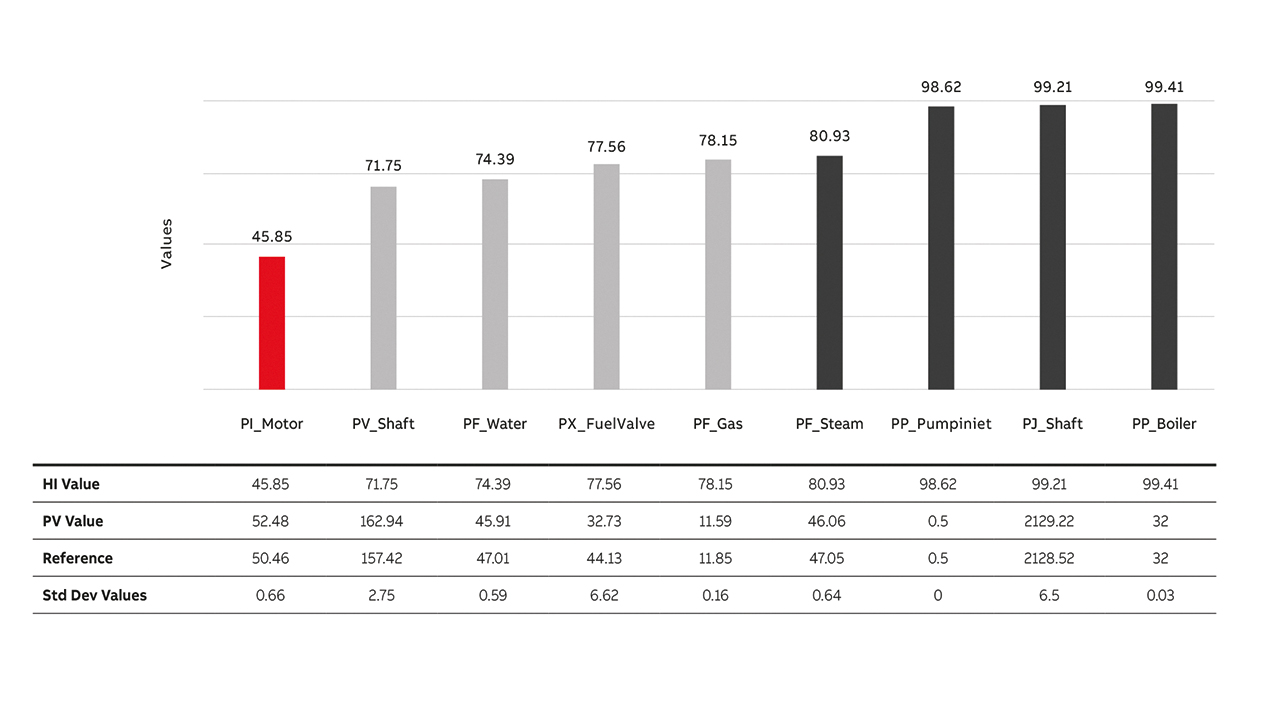
Additional to viewing the summary information for the KDIs and faults, users can view all indicators →04 ordered by score. For each fault, users can access the underlying KDI information →05. The standard deviation value is calculated for the values extracted from the data model using a KNN algorithm. This value is used to calculate the KDI score and provides an experienced user with insight into the underlying calculation.
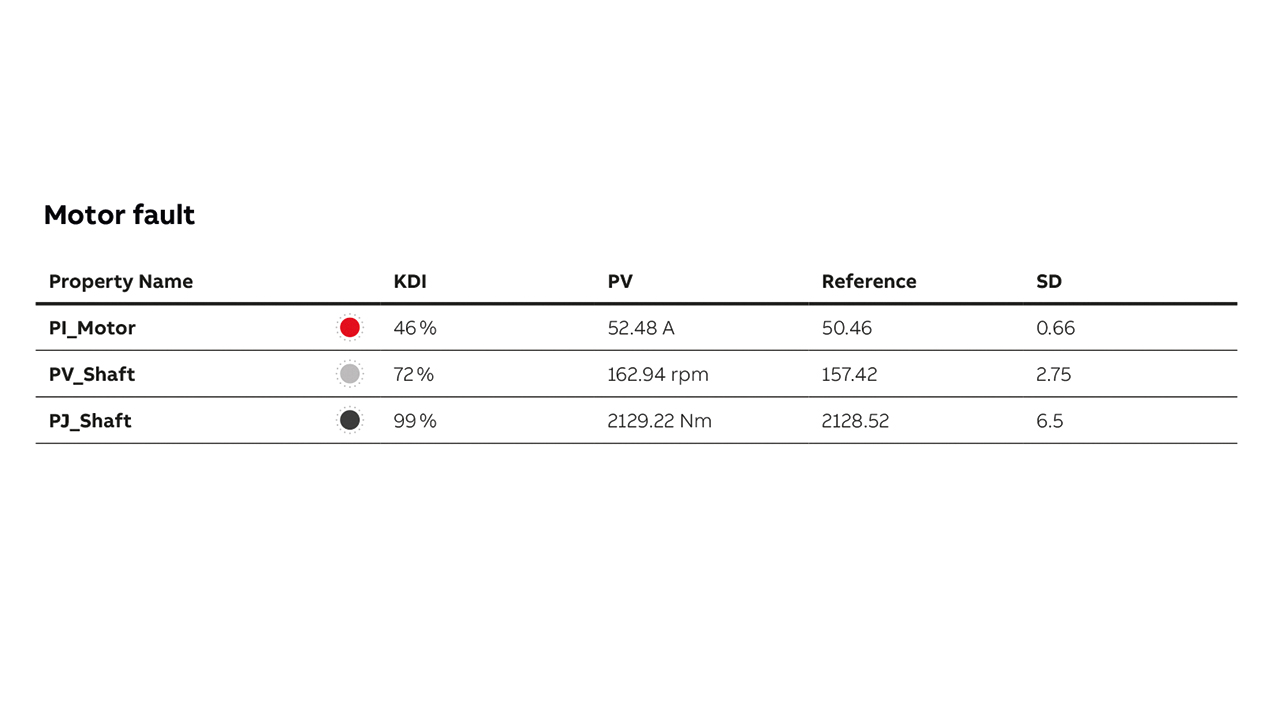
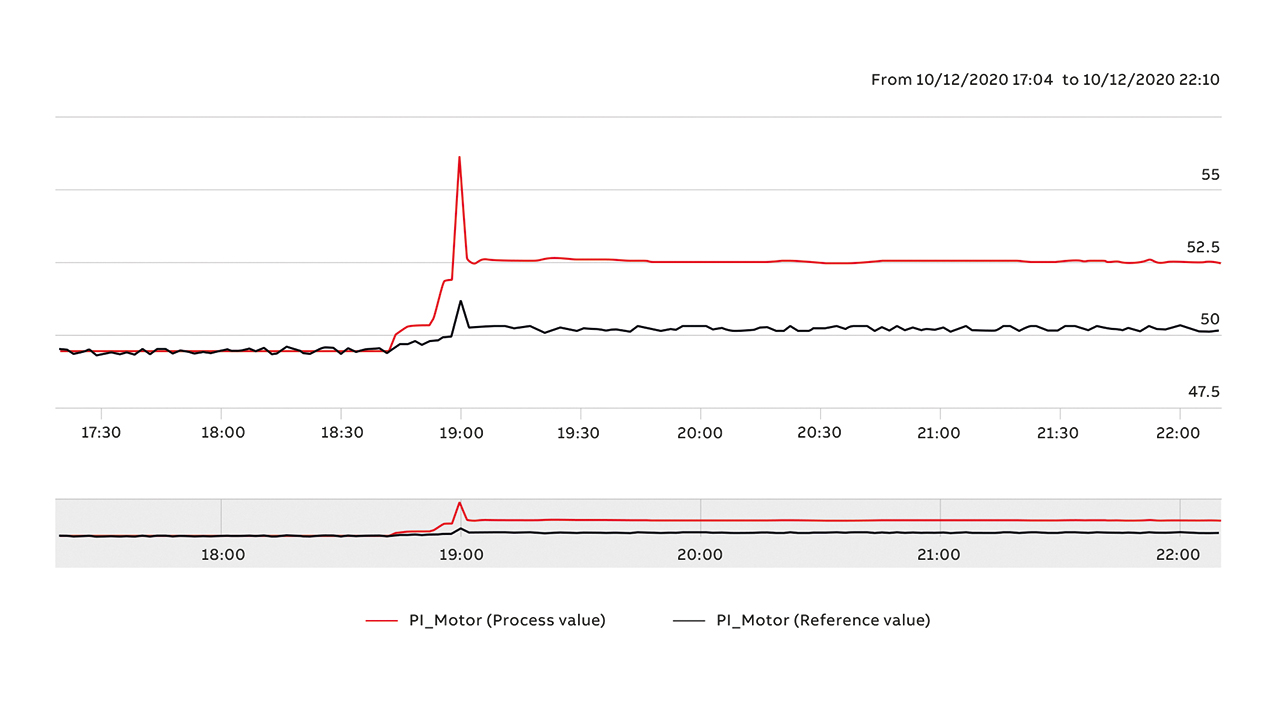
While the aforementioned indicators relate to the current equipment condition, to provide the basis for predictive maintenance →06 a forecast of future condition is required. First, the user is provided with historical trends to enable manual analysis →07; This is accomplished by providing historical trends for each of the key indicators.

Second, a forecast profile for the indicators that reach some future horizon is provided. This is calculated (and visualized) using the regression technique Auto Regressive Integrated Moving Average model (ARIMA).
The fault model provides additional information related to cause analysis and corrective actions, which are easily viewed →08. A fully automated workflow is provided by integrating the fault indicator values and the fault information with a Computerized Maintenance Management System (CMMS). Such systems typically orchestrate maintenance activities based on priority and resource availability.
Architecture of the proposed hybrid approach
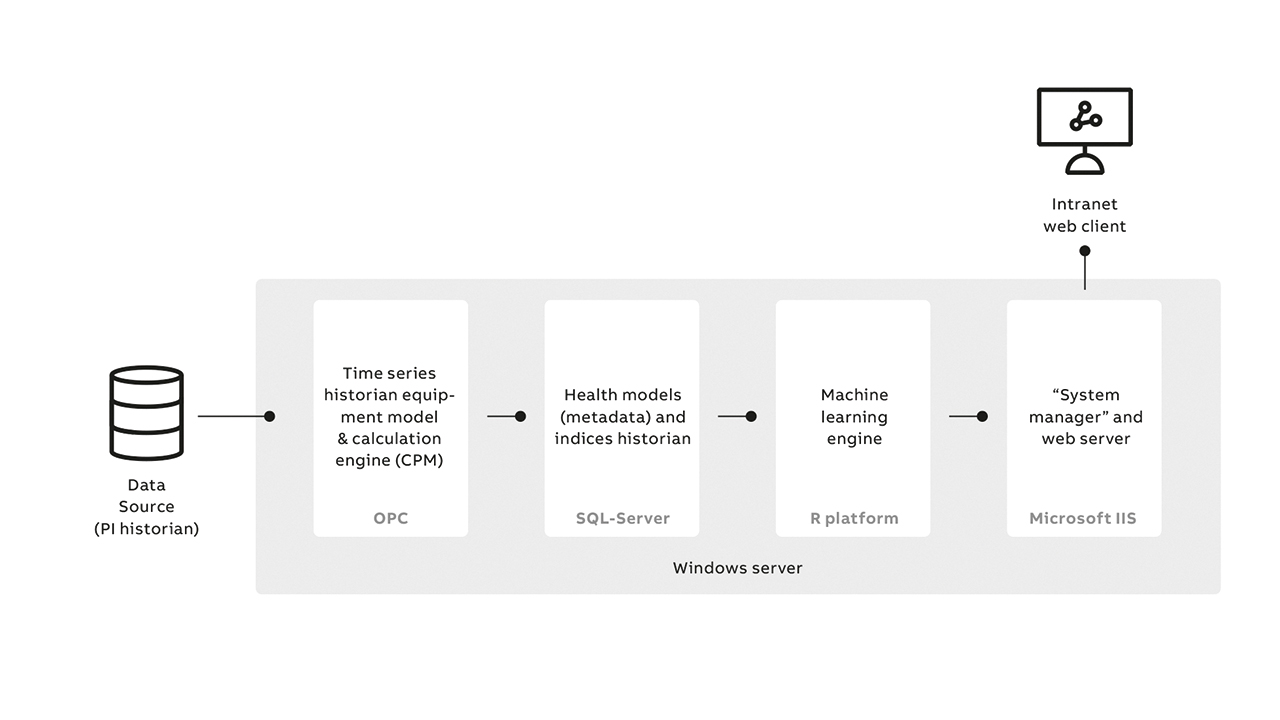
ABB has defined a typical architecture for use with the hybrid model approach →09. Here, the historical data of an asset that is stored in the historian trains the model. The historical data and calculation engine for the proposed application is ABB’s proprietary CPM platform. The MS SQL database is used to store the application data and models are trained and developed using an open source R platform. A web server is used to present the results and an intranet web client is employed to access and view results.
Hydropower plant testing
The resultant software has been successfully deployed in 33 hydropower plants by Enel Green in mid-2020. Currently, real-time condition monitoring of diverse assets, eg, hydro-turbines, pumps, motors, generators, etc. is ongoing with an anticipated project completion in 2022. Overall, the results are presented in a hierarchical view, combined, and can be easily viewed by users – a significant benefit. Initially, the assets are logically combined as per plant sub-section; these are then logically combined to represent the whole plant. The number of assets can be viewed that are in good- (green), borderline- (yellow) or poor (red) health at the plant level. A user can then drill down to different levels; a plant section or even a specific asset can be accessed; thereby accessing just the right information required.
Based on the initial pilot project success, ABB plans to expand the use of this hybrid approach to predictive maintenance to different industrial verticals such as conventional power plants, refineries, cement mills, the oil and gas industry, etc. This is possible because unlike first principle modelling that requires exact knowledge of sector specific equipment and processes, ML- and FMA modelling are completely generic by nature and therefore not industry specific – a transformational approach.
By putting industry’s needs first, ABB is developing the means to use the massive streams of generated data and advanced analytics to make predictive maintenance truly predictive; thereby ensuring process industries gain value from improving production to maximizing their return on the investment of equipment.
References
[1] V. Dilda et al., “Manufacturing: Analytics unleashes productivity and profitability”, in McKinsey & Company, Aug. 14, 2017, [Online]. [Available]: https://www.mckinsey.com/business-functions/operations/our-insights/manufacturing-analytics-unleashes-productivity-and-profitability [Accessed June 7, 2021].
[2] ARC Advisory Group, “Asset Performance Management Defined”, Website available [Online]. https://www.arcweb.com/technologies/asset-performance-management [Accessed June, 7, 2021].
[3] Z. Petrovic, ”Catastrophes caused by corrosion” in Military Technical Courier, Vol. 64, No. 4, 2016, pp. 1048 – 1068. Available: https://scindeks-clanci.ceon.rs/data/pdf/0042-8469/2016/0042-84691604048p.pdf
[4] Accruent, 2019, March 29, “5 Consequences of Reactive Maintenance Strategies”, [Online]. Available: https://www.accruent.com/resources/ blog-posts/5-consequences-reactive-maintenance-strategies
[5] M. Munir, et al., “DeepAnT: A Deep Learning Approach for Unsupervised Anomaly Detection in Time Series”. IEEE Access, Jan. 2019, pp. 1991 – 2004.
[6] H. Ringberg, et al., “Sensitivity of PCA for Traffic Anomaly Detection” in Performance Evaluation Review in SIGMETRICS, International Conference on Measurement and Modeling of Computer Systems, Vol. 35, Issue 1, 2007, pp. 109 – 120.