Felix Lenders, Nuo Li, Dennis Janka, Andrew Cohen ABB Industrial Automation Ladenburg, Germany, felix.lenders@de.abb.com, nuo.li@de.abb.com, dennis.janka@de.abb.com, andrew.cohen@de.abb.com
Cold-rolling mills (CRM) are an integral part of the metal production process, especially for steel production. To stay competitive, customers demand increased product quality; this means that acceptable thickness and flatness tolerances must decrease while surface quality must improve. And yet, increasing product diversity means that mills must handle a variety of materials while maintaining or even improving throughput and yield. To meet global market demands and remain competitive, producers of flat rolled products increasingly seek inexpensive ways to improve performance and product quality [1]. Responding to these business and technical needs, ABB has developed the next generation CRM digital solution: ABB Ability™ Data Analytics for cold rolling mills →01.
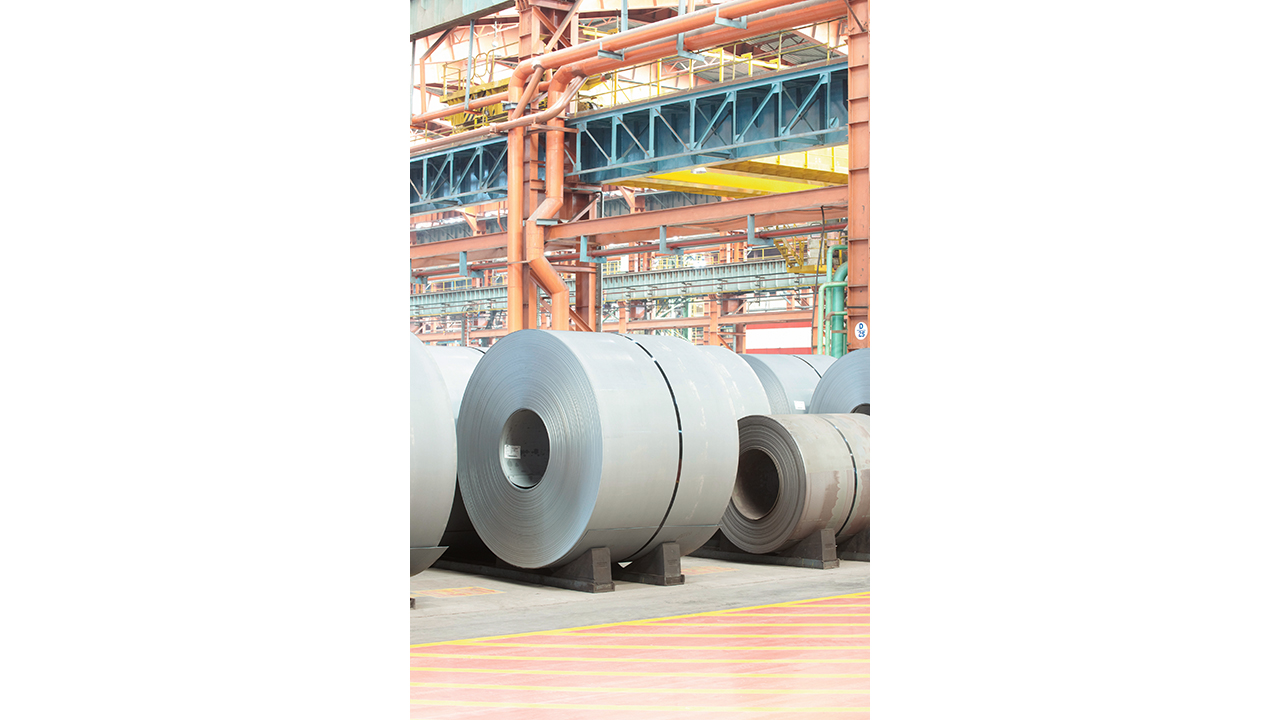
ABB’s advanced data analytics tool is rooted in the basic idea that CRM operators would gain crucial insight about performance, especially about deviations in product quality or problems with the production process, if they could observe equipment status in near-real time. But, achieving this goal is more easily said than done.
Exploiting the full production potential of CRM in today’s extremely competitive market requires a connected and integrated approach to automation, optimization, control and decision-support tools. The rolling process itself uses an upper and lower roll to reduce the thickness of a metal strip to a desired uniform thickness at a temperature below the crystallization temperature of the metal or alloy. Despite the conceptual simplicity of the goal, the rolling mill process is complicated and depends on a multitude of factors [2].
Nowadays, CRMs are equipped with modern control systems that include multiple sensors that continuously record vast amounts of data from measurements of flatness, tension, speed, strip thickness, etc. Control loops are put in place that react to this data. With sampling times in the range of milliseconds; approximately a thousand measurements of different sensor values are taken for each time-instance. Consequently, more than 3 GB of data are generated daily during mill operations. The available data is routinely exploited by ABB service engineers for the commissioning and maintenance of rolling mill devices with use of control loops. Nevertheless, this vast and valuable data is not regularly analyzed for performance purposes because manual analysis and data pattern screening require extensive effort and deep-domain knowledge – a tedious and costly endeavor.
To help customers unlock the enormous insight potential from raw data and to efficiently analyze the performance of their systems, ABB leverages the exceptional deep-domain knowledge of its engineers and draws on advances in neural network and advanced analytics applications for operational data to create an innovative digital service solution for process industries: Digital Solutions for Industrial Processes (SODA). Some key concepts derived from ABB’s research project, SODA, have been integrated into the new release of ABB’s CRM Data Analyzer: the ability to monitor and to detect problem signatures. In this way, the new CRM digital tool provides customers with the data they need to check the status of their cold rolling mills to assess productivity and product quality. By quickly guiding users to relevant information and providing interactive diagrams and plots, the CRM analyzer permits engineers to focus rapidly on relevant details: This simplifies analysis and fosters swift decision-making. Hence, actions can be taken to correct problems with less manpower.
Monitoring CRM operation
Because product quality and system productivity are critical key performance indicators (KPI) that directly impact profitability for CRM customers, operators continually monitor metrics to be able to detect deviations as early as possible. The goal is to recognize any perturbation that indicate possible industrial process degradation.
SODA is a sophisticated digital solution that helps customers fulfill their monitoring demands. By recognizing anomalies and best case circumstances, CRM operators can better manage their production process. In a first step, SODA synthesizes a “golden coil” from available historical data. The golden coil is a fictional coil that consists of time segments of varying lengths retrieved from the historical data at a time when product quality and mill productivity were maximal. Thus, these segments represent those operation modes in which the highest quality and productivity values were attained.
With this golden coil as a reference, SODA analyzes deviations within the historical data, thereby automatically learning a range of functional process behaviors, which are classified from poor to excellent. Currently, up to 100 different performance indicators are extracted from sensor measurements to compute the productivity and quality key performance indicators (KPIs) →02.
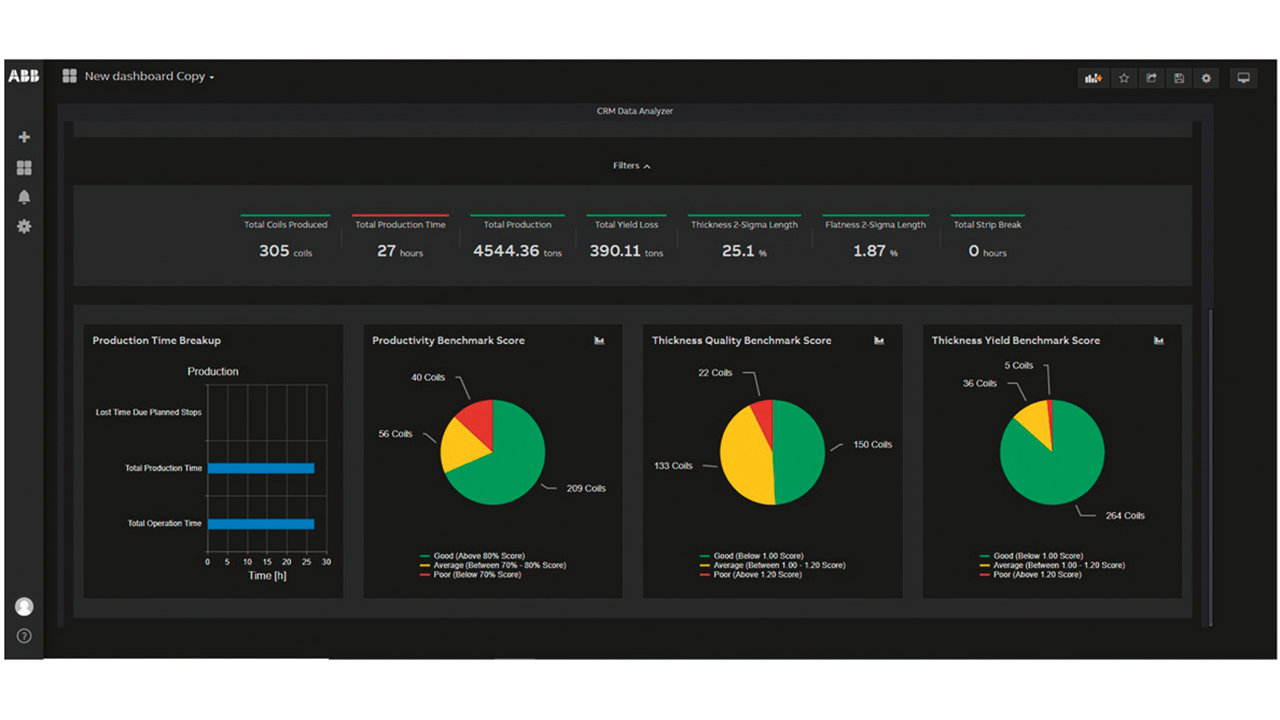
Once KPIs are calculated, SODA permits the user to assess the performance of the coil currently in operation by comparing it with the calculated golden coil and with examples of historical coils produced from the specific device being assessed. Coils can then be clustered according to performance (expressed by several indicators). This information is mapped to an instance of rolling a coil. By using the interactive graphical user interface (GUI) views provided by SODA, engineers can easily explore all relevant data. For instance, coils that demonstrate poor performance can be readily assessed and engineers can visually recognize patterns and any deviations; this makes troubleshooting easy.
With multiple ways to explore data, SODA allows CRM engineers to thoroughly evaluate performance quickly and accurately →03a–c. For instance, a coil characterized by poor performance can be selected; the velocity profile of this coil can be superficially compared to the golden coil. The engineer can also delve into detail and compare the selected dysfunctional coil with the optimal golden coil of any performance indicator →03b and, as a result, ascertain the reason for poor performance →03a–b. Roll geometry problems are also challenging and difficult to detect. Roll eccentricity can cause periodic variations in the roll gap; this can lead to undesirable variations in the thickness of the rolled product, negatively affecting both quality and productivity. Using spectral analysis, ABB’s digital solution for CRMs helps engineers detect roll eccentricity in near-real time →03c.

03a Velocity versus time for an individual dysfunctional coil is compared with the optimal golden coil. Poor performance is due to slower velocity and a longer period of acceleration than would be acceptable. 
03b Detailed view of time-dimension KPIs and length-dimension KPIs. Blue refers to the actual coil while orange indicates the “golden coil”. 
03c A spectral analysis example used to detect roll eccentricity.
03 Engineers can explore a variety of performance and product quality issues with the CRM Analyzer.
Detecting problem signatures in CRMs
SODA uses sophisticated algorithms to detect various characteristic and common problem signatures in time series data that arise from measurements: changing properties of incoming materials, eg, changing hardness of incoming material, or measurement mismatches due to improper tuning of control loops. Some of the algorithms are based on conventional signal processing while others rely on a machine learning-based approach rooted in deep and recurrent neural networks. The latter approach is especially suitable for time series data analysis due to its ability to model discrete time dynamic behavior. The process follows a conventional machine-learning approach in which a model is created during a training phase. The actual pattern of interest, which is intended to be detected, is characterized by examples as determined by a domain-expert and used to train the model. Finally, the model locates patterns within the time series data that are similar to those machine-learned examples.
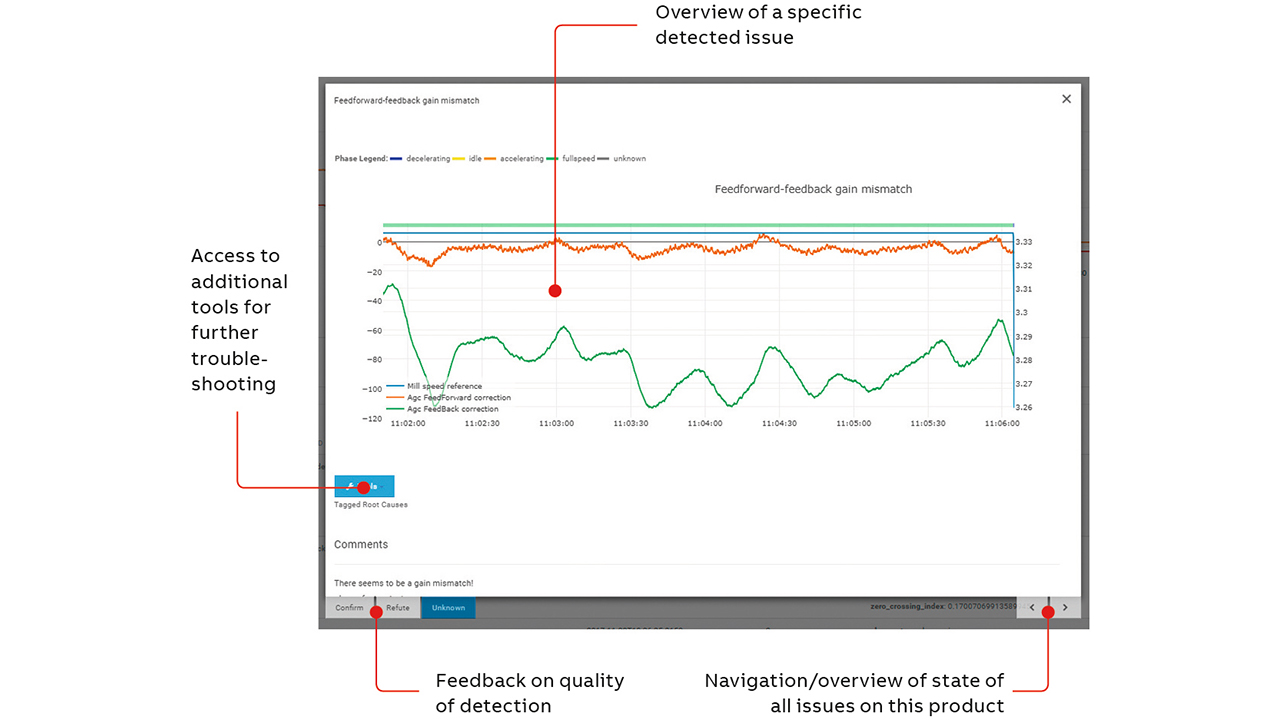
Operators can rely on ABB’s newest CRM tool to swiftly detect improperly tuned control loops →04. At times, the magnitude of the correction of the feedback control loop can be much larger than that of the feedforward control loop, yet correlate (having the same visual appearance) to the correction in the feedforward control loop. Here, the CRM tool visually indicates that both control loops are performing the same function; this is an undesirable state that leads to productivity losses. For the feedforward control loop to optimally fulfill its functional potential and perform the correction without the need for feedback control, the operator can tune the feedforward control to increase the gain. By detecting such problem signatures, any decline in performance or productivity can be comprehensively explained and service engineers can take actions to resolve problems.
AI assists feature detection in SODA
Despite its present unavailability for CRM, the use of artificial intelligence (AI) is another key concept developed in SODA with radical potential for CRMs. While conventional signal processing methods such as Fourier decomposition, correlation analysis and filtering are very effective and efficient for certain limited use cases, they are ineffective at detecting many relevant problems encountered in industry. For example, overshoot is an important characteristic of a control system related to step changes. In theory, overshoots have damped sinusoidal shapes for low-order linear systems. Common in CRMs →05, measured overshoots all have similar visual appearances, but their shapes, waveforms and durations vary; this makes them hard to detect with classical linear signal processing methods.
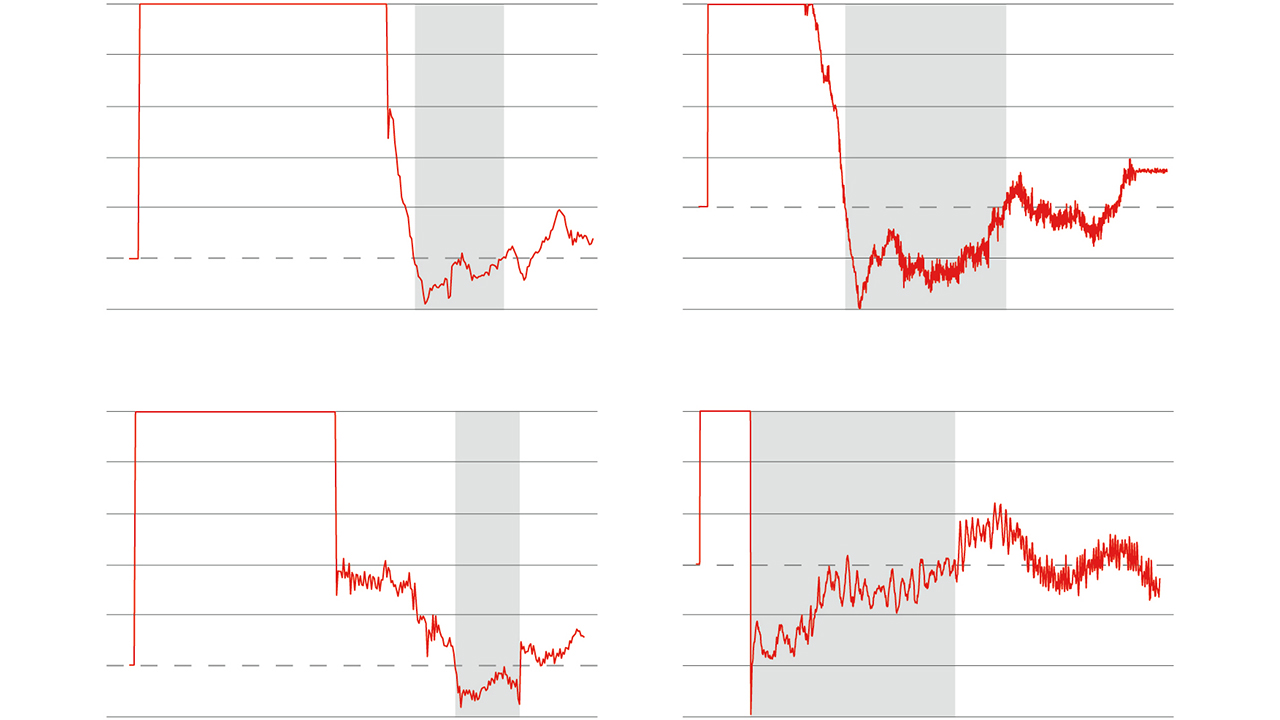
Hence, ABB developed and implemented a novel approach for feature extraction based on moving windows and recurrent neural networks that can learn arbitrary patterns in time series data. During the analysis, the engineer tags patterns of interest such as overshoots; these are then used to train a classifier based on recurrent neural networks [3].
This advantageous approach can be used generically to capture arbitrary patterns in univariate- and multivariate time series analysis based on an engineer-specialists’ inputs. This obviates the need to develop and tune specialized detection algorithms. Instead, this approach permits the expert’s domain knowledge to be utilized directly and, in addition, makes this knowledge widely accessible.
SODA software architecture
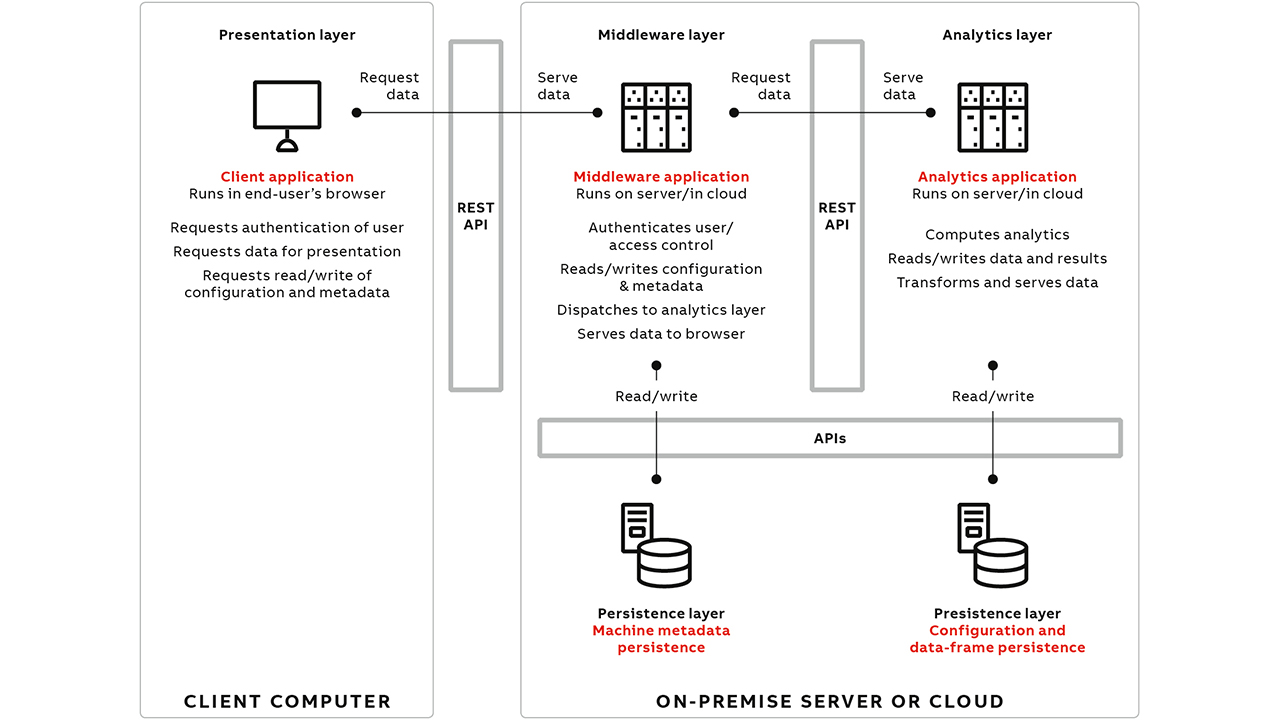
Using state-of-the-art technology and usage paradigms, SODA was developed as a modularized application with a web-based user interface. Divided into a client application, a middleware and an analytics engine →06; communication is handled by a web-based Representational State Transfer Architecture Application Protocol Interface (REST API). This modular framework can be run on-site or in the cloud, according to the customer’s privacy, flexibility, and scalability needs. This flexible, generic framework is easily adapted to other applications, eg, by reconfiguring the middleware, the framework can be adapted for use in other industries. Moreover, the analytics engine can run independently of other components, thereby forming the basis for any future application that requires similar types of analysis.
SODA advances and vision
As the world’s largest automation provider for metal processing, ABB has completed more than 450 projects over the past 20 years. It is this vast experience and accumulated deep-domain knowledge about operational data that has enabled ABB to develop best practices to glean valuable insight from available data: how to display data in meaningful ways, in the right context; how to simulate relevant scenarios; and how to act on insights from analytics to make informed decisions, to improve mill uptime, production speed and yield. By developing SODA with input and feedback from expert-engineers, ABB ensures that engineers’ work is optimally supported.
Currently, CRM customers can access the newly developed functions for monitoring operations and detecting problem signatures in the newest version of ABB’s CRM Data Analyzer.
Despite these significant advances, ABB continues to develop digital support technologies for CRMs by adding an artificial intelligent-assisted detection feature, already developed in SODA. This technology is planned for a future version of the CRM Data Analyzer.
Not stopping there, ABB is expanding its digital offerings. Having created a tool that provides an overview of the production performance, and detects anomalies accurately, ABB’s newest challenge is to create a digital solution that will identify the root causes of these anomalies. Always at the vanguard of innovation, ABB is researching this solution right now.
References
[1] L. Mori, et al., “Unlocking the Digital Opportunity in Metals”. Metals and Mining Practice, McKinsey & Company, Jan. 2018, pp. 1 – 16.
[2] A. Kroll and A. Vollmer, “Industrial IT for cold rolling mills”. ABB Review, 4/2004, pp. 44 – 49.
[3] D. Janka, et al., “Detecting and locating patterns in time series using machine learning”, in Control Engineering Practice, vol. 93, Dec. 2019.