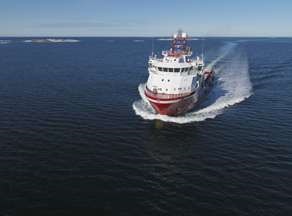
Dina Star - The expected space and weight saving, and improved fuel efficiency was based on theoretical analysis and testing in a laboratory environment. Now that the first installation has been in operation for more than a year, we have a good understanding of the real-life performance of Onboard DC Grid.
The Onboard DC Grid concept was described in Generations 2012, and is based on a principle where the output of the AC generators is rectified before connecting to the common DC distribution system. The DC distribution enables for using bus ducts to transmit even high power levels, without the use of a main AC switchboard and drive transformers. Advantages of DC distribution, in certain cases, include lower overall losses and fewer problems with harmonic distortion. Yet historically there have been challenges with DC distribution, primarily revolving around how full selectivity and equipment protection can be achieved in ways that are similar to AC distribution. AC currents are by nature simpler to interrupt because of their natural zero crossing every half cycle. ABB overcame these challenges by breaking with the classic protection philosophy, where selectivity is achieved through an arrangement of coordinated circuit breakers, and instead capitalizing on the opportunities afforded by power electronic components in the onboard DC grid system.

Power distribution and configurations
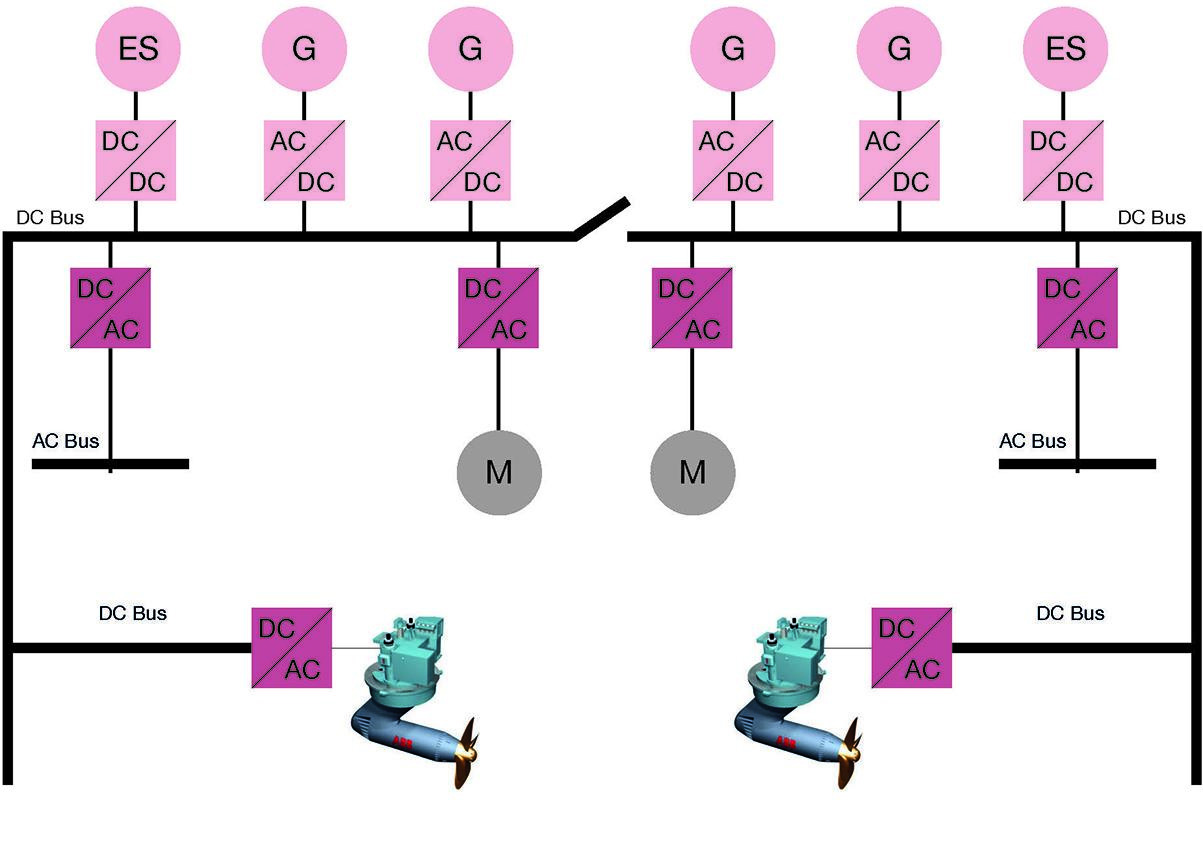
In traditional electrical propulsion systems, variable frequency drives typically account for more than 80 percent of the installed power. At its simplest level, the Onboard DC grid is a reworked and distributed multi-drive system (Figure 1).
The solution merges the various DC links around the vessel and distributes power through a single 1,000V DC circuit, thereby eliminating the need for main AC switchboards, and converter transformers. All electric power generated is fed either directly or via a rectifier into a common DC bus that distributes the electrical energy to the onboard consumers. Each main consumer is then fed by a separate inverter unit.
As the DC only couples the various energy sources through a common voltage, the generators do not need to be synchronized and may even operate at different frequencies. It is also simple to connect energy sources with DC output to the DC distribution without concern about frequency conversion or synchronization. This allows for easy adaptation of batteries and super capacitors to the power system, which will enhance energy efficiency for many vessel types and operations.
When an AC distribution network is still needed, for example with a 230V hotel load, it is fed using island converters developed by ABB to feed clean power to these more sensitive circuits. Additional converters for energy storage, in the form of batteries or super capacitors for leveling out power variations, can be added to the DC grid.
Variable speed diesel engines
AC-based diesel electric propulsion technology has a high overall efficiency, above 90% in the electrical grid, but only allows engines to be operated at one fixed speed, due to a determined constant frequency. The engines have an overall efficiency of around 45–50 percent, and the most optimal fuel operational window is between 75 and 85 percent. In order to improve the environmental conditions and reduce fuel costs during low load conditions, variable speed operation of engines needs to be looked into.
ABB’s Onboard DC Grid technology allows variable speed operation of engines, which traditionally have been run in constant speed to maintain a constant frequency, regardless of power demand. The newly developed technology not only allows variable speed operation but, due to a DC-based distribution, bulky electrical equipment can be eliminated. All this has many positive effects for the shipowner and crew. Most notable are a large reduction in noise and vibration, increased SCR effectiveness, longer runtime between service, less wear, reduced consumption of lubrication oil, reduced operational and maintenance costs and a notable reduction in fuel costs.
Pilot Installation
ABB delivered the first Onboard DC Grid system to MS Dina Star, owned by Myklebusthaug Management in Norway. Pon Power delivered the 4 x 3516C main engines and 1 x C32 harbor generator for the ship.
This article will further review the differences in fuel consumption and noise reduction for a variable speed system (1200–1,800 rpm) compared with the same system run in fixed speed at 1,800 RPM with load steps and varying loads.
Making a direct comparison between a fixed speed engine and a variable speed propeller engine is difficult when measuring on two separate ships because it is near impossible to achieve identical conditions. Thus, the comparison in this report is between a CAT 3516C propeller engine, rated at 2350 bkW, running in variable speed at 1,200–1,800 RPM and the same engine locked in fixed speed at 1,800 RPM.
The fuel measurements were performed in cooperation with Pon Power AS, Denmark. Tests were performed on a voyage from Peterhead, Scotland to Haugesund, Norway between May 18 and 19, 2014.

Testing description
The main goal was to understand the performance of operating engines at variable speeds of 1,200–1,800 RPM compared with fixed speed at 1800 RPM.
The results presented in this article are from two tests:
- DP (Dynamic Positioning) Operational fuel measurement test – the objective was to verify differences in fuel consumption during a real world vessel operation running at variable and fixed speed.
- Load step fuel measurement test – the objective was to verify difference in fuel consumption at stable load levels of 10 percent increments.
DP Operation fuel measurement test
It was decided to execute a DP mode test with fluctuating loads. The DP operation was deemed the most relevant to execute, as transit, harbor and other operational modes do have a more or less constant load. To show fuel savings in a varying load scenario, a test was done in DP mode on a single engine. Fuel was only measured on a single engine, but two engines were running to keep the position accordingly.
First, the engine was run at variable speed for 45 minutes and then for 45 minutes at constant speed. The PEMS (Power and Energy Management System) data were used to compare time, fuel, power and RPM data. The power was integrated over the time period for the variable speed test and the produced energy in kWh and fuel consumption was calculated.
For the constant speed test, the power was also integrated and the fuel consumption noted at the time when the produced energy was the same as the energy produced during the variable speed test. This makes the results directly and academically comparable.
Load step fuel measurement
The purpose of this test was to show the fuel consumption under a stable load, the effectiveness of the SCR system and effect on engine room noise level. This load test was performed with 10 percent load interval from 10 percent to 90 percent.
The engine was run first in variable speed with asymmetric load sharing to a fixed load from 10– 90 percent. The load fluctuated slightly and the burn rate fluctuated accordingly within a few liters/hour. The ship hitting a wave would cause the burn rate to momentarily go up and then settle again. The mean burn rate value was logged during the test procedure, and is later presented in the result section. Only one value was noted for each load level.
Exhaust temperature and sound level were also noted during each load step.
Results
The performed tests demonstrated advantages in all aspects when running engines in variable speed mode. Both the 10 percent load step test and the varying load test showed lower fuel consumption for variable speed operation.
The lower load range in particular showed fuel savings of up to 27 percent at lowest load, a decrease in sound pressure level of 5 dB from 1200 to 1800 RPM, which equates a reduction in engine noise loudness of around 30 percent, and an increased effectiveness of the SCR system to include the whole tested operational range from at least 10–90 percent load.

Figure 2 Two SFOC curves for variable and fixed speed 10 percent load steps 
Figure 3 Fuel savings (variable vs fixed) – power trend line added
Test 1: 10 percent load step test results
The 10 percent load step test showed impressive results, where a fuel reduction of up to 30 percent was shown when variable speed operation was allowed. Figure 2 shows the specific fuel oil consumption results of the 10 percent load step. The graph shows and represents the results from CAT fuel flow meters over average electrical power.
Figure 2 shows and summarizes specific fuel consumption for variable speed and fixed speed through the entire load range the engine is able to carry.
Figure 3 shows and summarizes the fuel savings for variable speed and fixed speed through the entire load range the engine is able to carry. Figures 4 and 5 show the load applied when both variable and fixed speed operations were executed with 10 percent load step increase.
As shown in Figure 4, there was a step at 73 percent load. This has been removed from the values used in the SFOC curve. It was caused by a disproportionate number of engines running compared to the load demand when the load step was switched to 80 percent and an engine had to be shut down to allow 80 percent load on the tested engine.

Figure 4 Variable speed load steps 
Figure 5 Fixed speed load steps 
Figure 6 Variable speed DP load/RPM/fuel trend
Test 2: Varying load test – DP mode
The DP test lasted 45 minutes and was run first at variable speed and then at fixed speed at 1,800 RPM. Both tests were run on the same engine. The ship was turned so that the weather conditions would give the most load variations when keeping the ship in position. The two tests were performed over 90 minutes and weather conditions were as follows:Wind speed: 15–22 m/sWave high: 2– 3 m
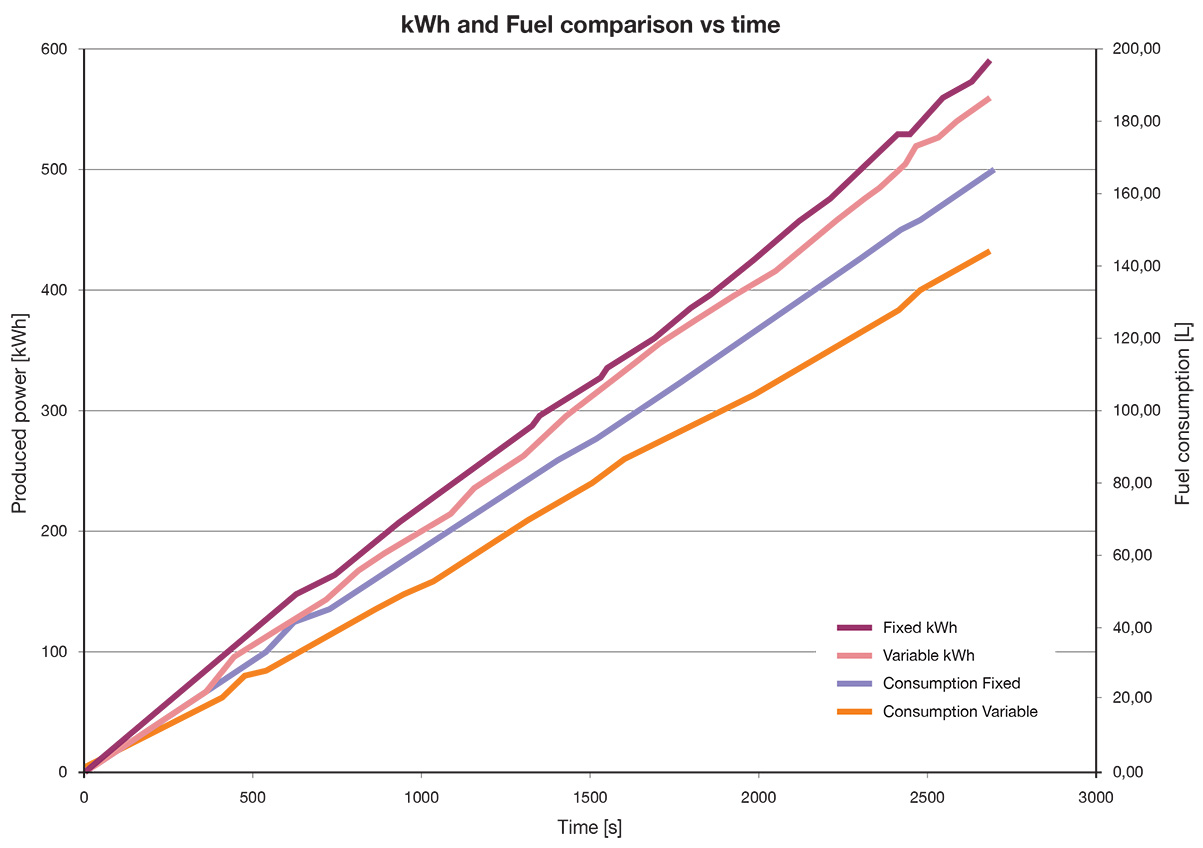
The raw data were divided into separate spreadsheets, variable and fixed speed. Time was converted into a second format, starting from 0, counting approximately 1.04 seconds between each logging. Seconds were logged with 3 decimal points, giving a resolution of milliseconds. The power was then integrated for the whole duration, leaving a column with the total produced energy at each logging. That way it was possible to see produced energy and fuel consumption at any point during the test. The total energy production for the variable speed DP test was 558.51 kWh and there was a fuel consumption of 144 liters (see Figure 6).
The same test was then repeated with the diesel engine in fixed speed mode. Figure 7 compares the logged energy production and fuel consumption in the two modes, variable and fixed RPM. As seen, the produced energy is slightly higher in fixed RPM mode, likely due to differences in the transient behavior of the engine in the two modes. However, the difference also reflects the real difference between the two modes and is thus relevant for the comparison.
The results are presented in Table 1; showing that for the comparable time period of the same test procedure, the fuel consumption over the whole test cycle is reduced by 13.77 percent when allowing the engines to optimize the RPM for the varying loads.
| TEST | PRODUCED ENERGY |
CONSUMED FUEL | FUEL SAVING | RUN TIME [S] |
| Variable speed test run | 558,51 kWh | 144 l | 2683 | |
| Fixed speed test at same produced energy as var. | 558,46 kWh | 158 l | (158-144)/158*100 = 8,86% |
2549 |
| Fixed speed - Time equal to variable speed test run | 589,14 kWh | 167 l | (167-144)/167*100 = 13,77% |
2863 |
Conclusion
In the 10 percent load step test, the results show a 27 percent fuel saving at 10 percent load down to 3,5 percent fuel saving at 80 percent load when running the engine at variable speed from 1,200 to 1,800 RPM.
In the varying load DP test, when comparing the consumed fuel in the DP test for the same time period, the result is between 9 percent and 14 percent for variable speed depending on the comparison type. It is important to highlight the difficulties in achieving exact identical conditions during a real world test. However, the two tests give a result between 9 and 14 percent, which is in line with or even exceeds the theoretical expected figures for this operation mode.
